If you are an active trader you might have noticed that financial asset prices follow certain patterns. A pattern that consistently occurs is consolidation between price ranges.
Financial assets will often trade in a tight range, consolidating a recent move, and then move to another range and repeat the process.
Even during market trends prices tend to target specific levels before moving on to the next region. One of the best ways to forecast price targets is through Fibonacci retracements analysis.
Fibonacci retracement analysis can be used to confirm an entry-level, target a take profit as well as determine your stop loss level.
What are Fibonacci Retracement levels
Fibonacci numbers were initially calculated based on a mathematic concept derived centuries ago. They were created from a ratio that is driven by the Fibonacci sequence discovered by an Italian mathematician in the early 1400s.
The Fibonacci sequence provides the information need to formulate support and resistance levels which can be used within your risk management framework.
You can use Fibonacci retracement levels on their own or combine them with other trading methodologies. The Fibonacci sequences were used to formulate other theories such as the Elliot Wave Principle and Dow Theory. You can also use Fibonacci ratios with other technical analysis tools.
The Fibonacci Sequence and the Golden Ratio?
Leonardo Pisano Bogolla discovered the Fibonacci sequence. This Italian mathematician uncovered a ratio within a sequence of numbers that follows a pattern.
The sequence starts on the second number where each number in the sequence is the sum of the prior 2 numbers. For example, , 2+1 is 3, and then 5, 8, 13,21, etc.
How to Calculate Fibonacci Retracement Lines
Fibonacci retracement levels are the most common technical analysis tool created from the Fibonacci gold ratios.
The 38.2% Fibonacci ratio and the 61.8% Fibonacci ratio are calculated by subtracting the recent high from the recent low and targeting the impending rebound. Most of these points are calculated by your charting software.
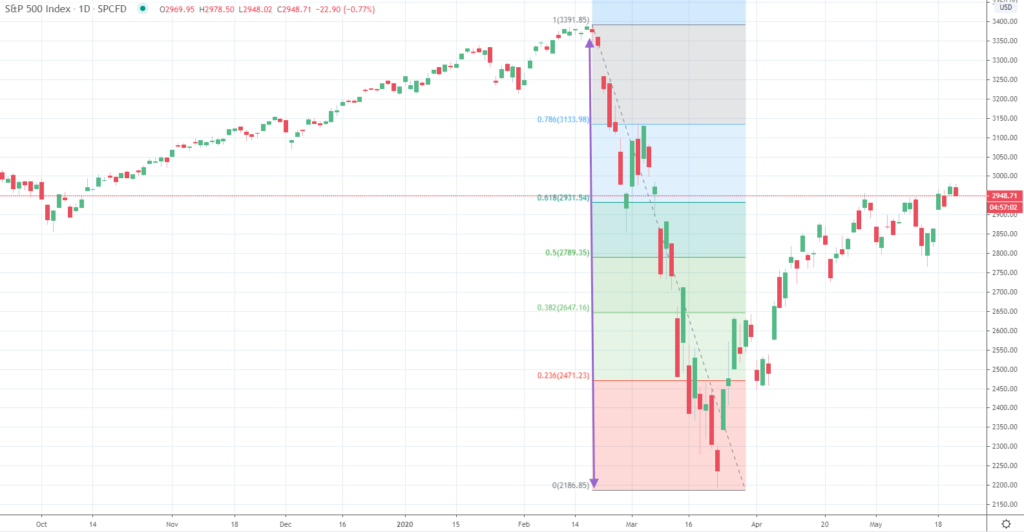
You can see in the chart of the S&P 500 index that the Fibonacci Retracement levels act like magnets creating a self-fulfilling prophecy.
The realization that COVID-19 would spread throughout the United States created an instant bear market beginning in February and hit a bottom in March. Prices dropped from approximately 3,400 to 2,200 and then rebounded to the 38.2% retracement level.
If you take the drop and multiple that decline by 38.2% and then add that figure to the low (2,200), you would find the 38.2% Fibonacci retracement level, which is 2,647. At this point the index started to consolidate.
After a period of consolidation, prices retested the 38.2% retracement level and broke to the next level which was the 50% retracement. The consolidation was brief. The S&P 500 index then moved to test the 61.8% retracement level and has consolidated around that region.
When you draw Fibonacci retracement lines, you will measure the peak to trough of the move that you are targeting. The difference between the high and the low is then multiplied by 61.8% and 38.2%.
These results are added to the low if you are measuring a decline, or subtracted from the high if you are measuring a rally. These levels will become your target resistance as the price is rebounding or support during a correction.
Strategies for Trading Fibonacci Retracements
There are no restrictions on the time frames that you can use Fibonacci ratios. You should feel just as comfortable using this technique on intra-day data as you would on daily or weekly prices.
The golden ratios will work on all periods you decide to analyze. You can use Fibonacci numbers as a method for finding support and resistance levels, as well as for risk management.
You can predetermine your stop loss level and take profit targets using Fibonacci retracements before you enter a trade.
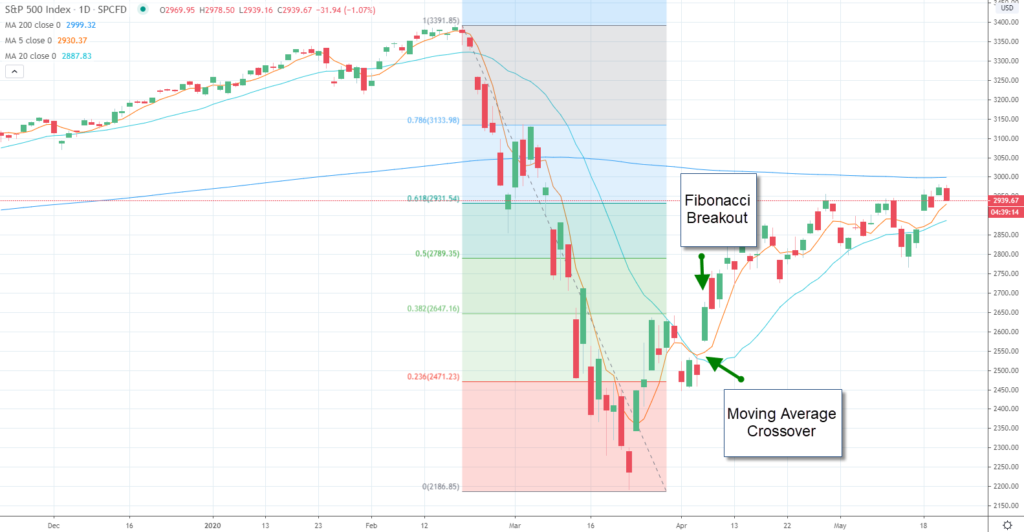
You can also use Fibonacci Retracement levels in conjunction with other studies such as moving averages that can act as a confirmation indicator.
For example, following a short-term moving average crossover where the 5-day moving average crosses above the 20-day moving average, you could wait until the S&P 500 index breaks through the 38.2% retracement before entering your trade.
You can also see resistance near the 200-day moving average which coincides with the initial resistance the S&P 500 index experienced at the 61.8% retracement level.
Bottom Line
Fibonacci retracements trace their roots back to Fibonacci numbers where were discovered centuries ago and developed into a technical analysis tool.
The Fibonacci retracements are calculated by using common Fibonacci ratios which are calculated from the Fibonacci sequence.
You can use the Fibonacci retracements to uncover support and resistance levels which can be used as targets to either stop out of a position or take profit on a trade.
Additionally, you can use these target levels as confirmation indicators used in conjunction with other technical indicators such as moving averages, stochastics, and momentum.
The most common Fibonacci ratios are the 38.2% ratio and the 61.8% ratio. Other ratios are also used, such as the 50% ratio first described in Dow Theory, as well as the 23.6% ratio, which represents a short-term target.
Fibonacci retracements can be used as a risk management tool. The targets can be used to determine your risk versus reward ratio before entering a trade, as well as, an active management tool to uncover new levels of support and resistance.
One of the most important concepts that are uncovered by the Fibonacci retracements is periods when the market is likely to consolidate.
These levels initially do not provide a gauge to whether the market is pausing only to refresh or reversing. When prices begin to consolidate around a Fibonacci level, a retest of the level will be inevitable.
If prices continue to trend through the 38.2% retracement they are likely to test the 61.8% retracement.


