

Want to take control of your trading?
The best way to do so is to arm yourself with the right tools. One of the best tools for traders or investors is stock charts. With stock charts you can analyze price action, locate the best levels to trade off of, see trends and much more.
However, charting software can be really expensive so we went ahead and researched all the best free stock charts just for you!
Want to learn more? Keep reading!
What are stock charts?
Stock charts are a visual representations of a stocks price action based on time and price. Along the x-axis is time which tells you at what time the trades went off and along the y-axis you have prices which tells what prices were traded.
You can add a ton of different indicators to your charts including volume, moving averages, stochastics or Bollinger bands to name a few.
This is a price chart showing stock prices and other important information such as stock symbol, price change, and net change. The data is plotted over a time frame, for instance, day, week or month.
There are three main types of charts. You have:
- Line chart – used to plot the closing price of a stock
- Bar chart – tracks 3 to 4 price points
- Candle and stick chart (most popular) – uses 4 types of price data to provide investors with accurate information of the price action
How to read stock charts
Learning how to read a stock charts is important if you are going to trade stocks. They can seem a little overwhelming at first but once you get the hang of them it’s really easy to understand.
The first step is to familiarize yourself with the interface. When you open a stock chart for a specific company such as Google, a bunch of information is displayed on your screen. You will have the company name (Google), ticker (GOOGL), open, high, low and close. You will also have volume data, market capitalization, buy and sell data.
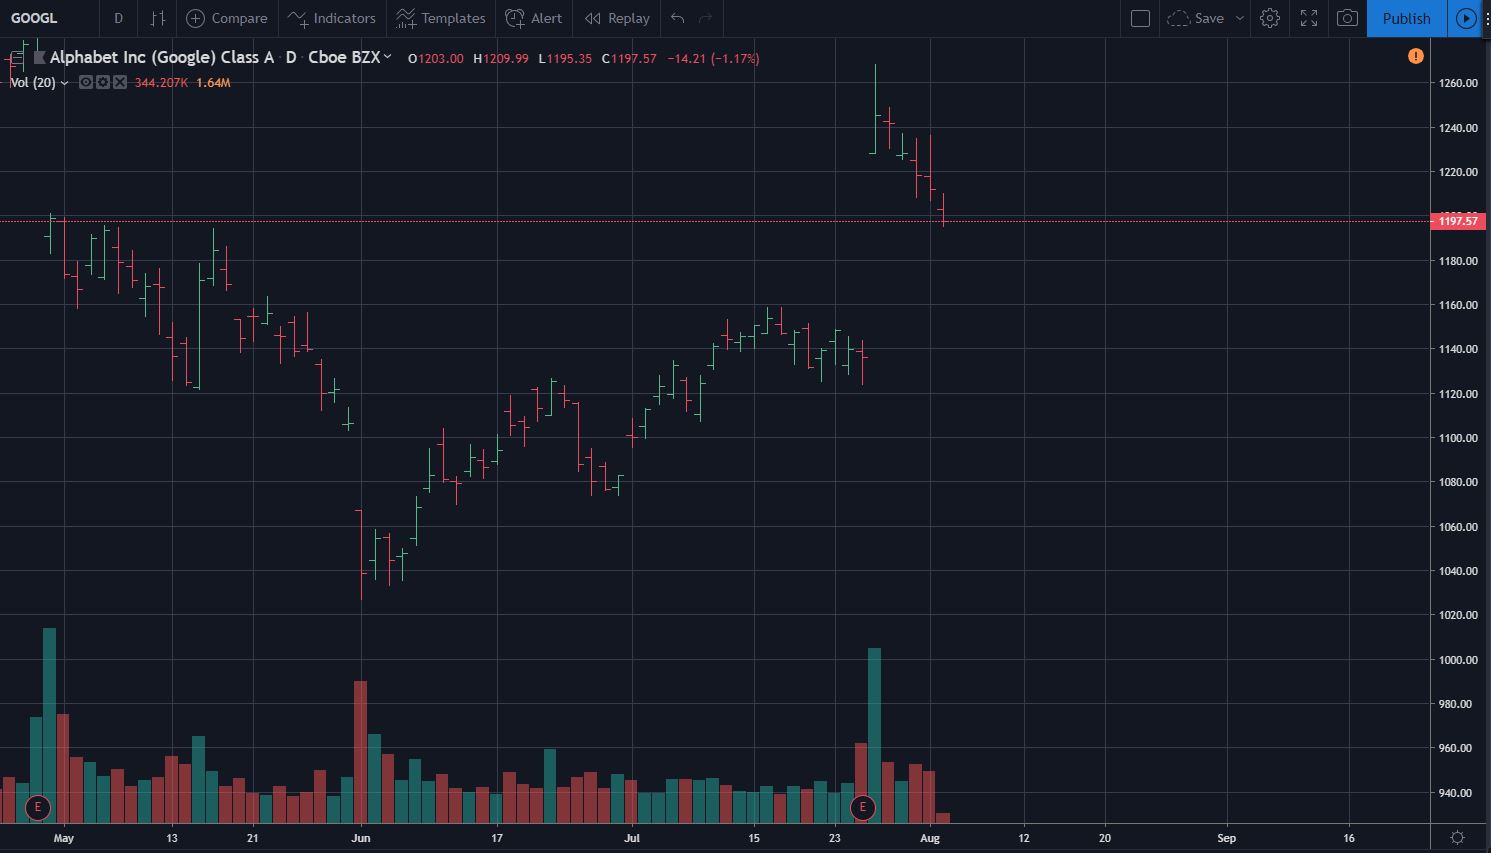
In this example, we will use the bar chart. The green and red vertical bars wandering across the graph represent the changes in stock price. Each vertical bar represents the highest and lowest prices of the stock.
A tall bar means the price was volatile while a short bar indicates price movement was less volatile. If the price was lower at the end of the interval than the beginning, the bar is red. It’s green if the stock price went up during that period.
At the bottom of the chart, you have the choice of changing the time interval. You can select a shorter or longer duration. If you select a one-day interval, the bar chart will represent the stock price range for the entire trading day.
What you need to know is that weekly charts display long term trends while intraday charts display price action within the day. You can have time frames all the way down to less than a minute or even tick charts for really fast price action.
What to look for in stock chart software
Wondering how any charting software can help you find winning stocks? Charts are the portal to the markets for day traders. Thanks to the many features available with stock charts, traders have access to a lot of market information.
When looking for stock chart software, here is what you should consider:
- Lines – can the stock chart software support vertical, horizontal and trend lines? Lines are important when it comes to analysis. For starters, they help you to identify support and resistant levels. They also help you to recognize trends.
- Symbols – the best stock chart software should have a good library that enables you to load images as symbols. It should also allow you to mark signals with symbols such as exit long, buy, exit short and sell.
- Line studies – good software should provide pre-built support for line studies. They include Gann Fans, quadrant lines, Speed lines, Raff Regression, and Tirone levels.
- Different shapes – drawing tools such as shapes, rectangles and ellipses allow you to highlight specific price action.
Other factors to consider include easy to use interface, support for technical indicators, support for different chart layouts, color, fonts, and Fibonacci studies.
A brief overview of the best free stock charts
1. Tradingview
If you value a stock chart software with great technical and fundamental analysis, then we recommend Tradingview. Made for day traders, the software lets you discover investment ideas and learn from the community.
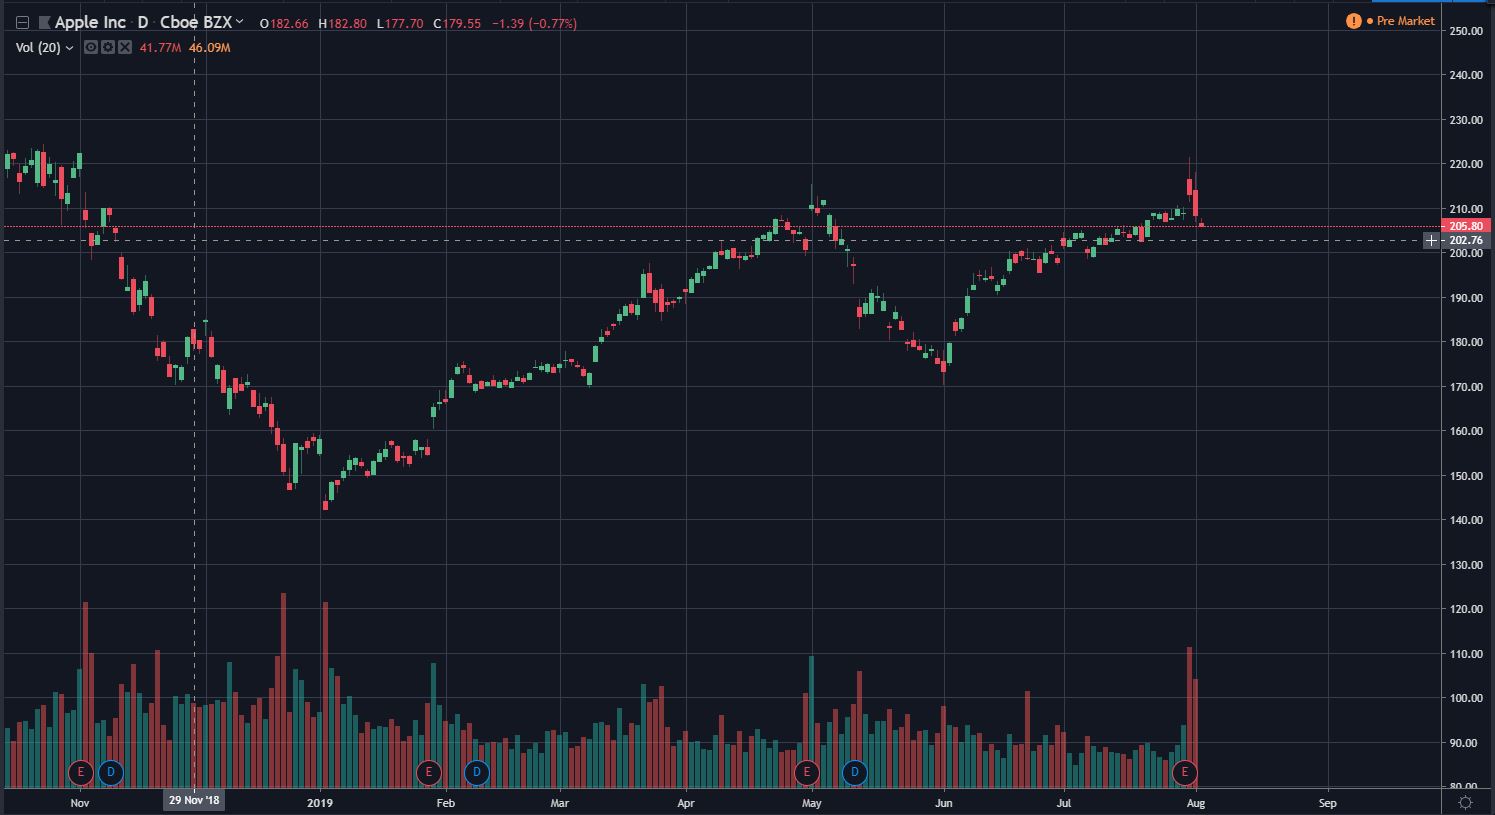
Easy and intuitive, no complex setups or installations needed. You can access browser-based charts with real-time data getting you started immediately. Like most stock chart software, Tradingview is free but to access advanced features, you need to upgrade.
Tradingview features include:
- Different chart types
- Spread charts
- Advanced price scaling
- 50+ intelligent drawing tools
- Multiple chart layouts
- Server-side alerts
- Stock screener
- Supports multiple brokers
- Customized technical analysis
- Broad market data coverage
Apart from accessing in-depth features, upgrading to Pro($12.95/mo), Pro+($24.95/mo) or Premium($49.95/mo) allows you to enjoy an ad-free experience. You also have access to Tradingview social network where you can learn from community members.
2. Stockcharts.com
With Stockcharts.com, not only will you get to see markets more clearly but you will find new opportunities and improve your portfolio management. StockCharts is trusted by millions of day traders and online investors around the world. Why? It creates the highest-quality financial charts in seconds.
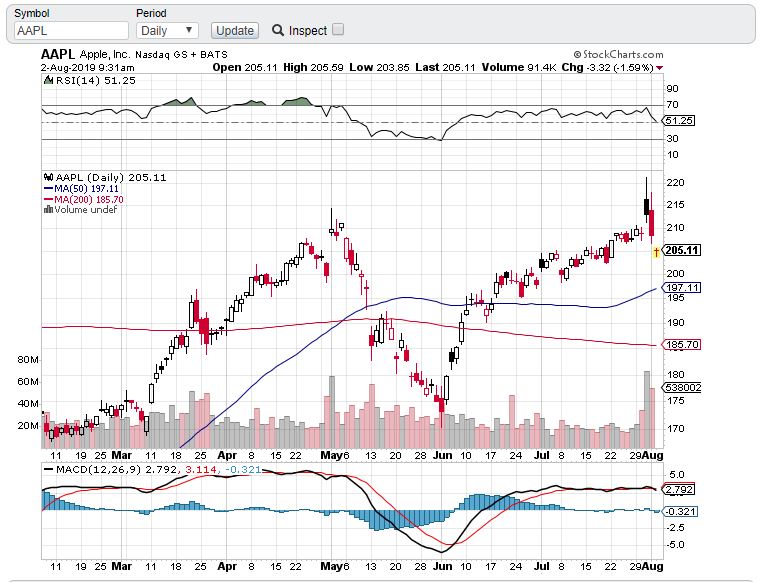
You can also create bigger and more advanced charts or run custom scans to locate winning stocks. Plus, you can set automatic alerts and receive daily market commentary from industry-leading traders.
Try StockCharts for free thanks to the 1-month free trial and if you like how the software works, upgrade to Basic ($14.95/mo), Extra ($24.95/month) or Pro($39.95/mo). StockCharts has award-winning features such as:
- Advanced winning chart
- Real-time intraday data
- More indicator and overlays
- Organize charts with ChartLists
- Intuitive Member’s dashboard
- Advanced technical scanning
- Custom alerts
- Expert market commentary
With StockCharts, you don’t have to download or install any software. You can access everything on a modern browser using your laptop, desktop, tablet or smartphone.
3. Finviz
Financial Visualizations is a free stock chart software that has remained unchanged for many years. It has a stock screener which allows you to screen using a variety of technical, descriptive and fundamental metrics. It also provides useful information such as quotes and real-time news.

Apart from the stock screener, you have the heat map with S&P 500 index stocks grouped by industries and sectors. If you desire, you can switch from the map to bubbles. FinViz also provides data on futures, forex, and crypto.
Although FinViz is a great tool for the advanced day trader, it has a few constraints. For starters, users are constrained to using the drop-down menus with pre-specified ranges. As such, you cannot select or input your values. Second, FinViz does not allow you to export results without signing up to its Elite service ($24.96/mo).
Available features offered to FinViz Elite users include:
- Real-time quotes
- Premarket data
- Advanced visualizations
- Backtesting
- Advanced screener
- Alerts and notifications
The good news about FinViz is that it can help you make sound stock-picking decisions.
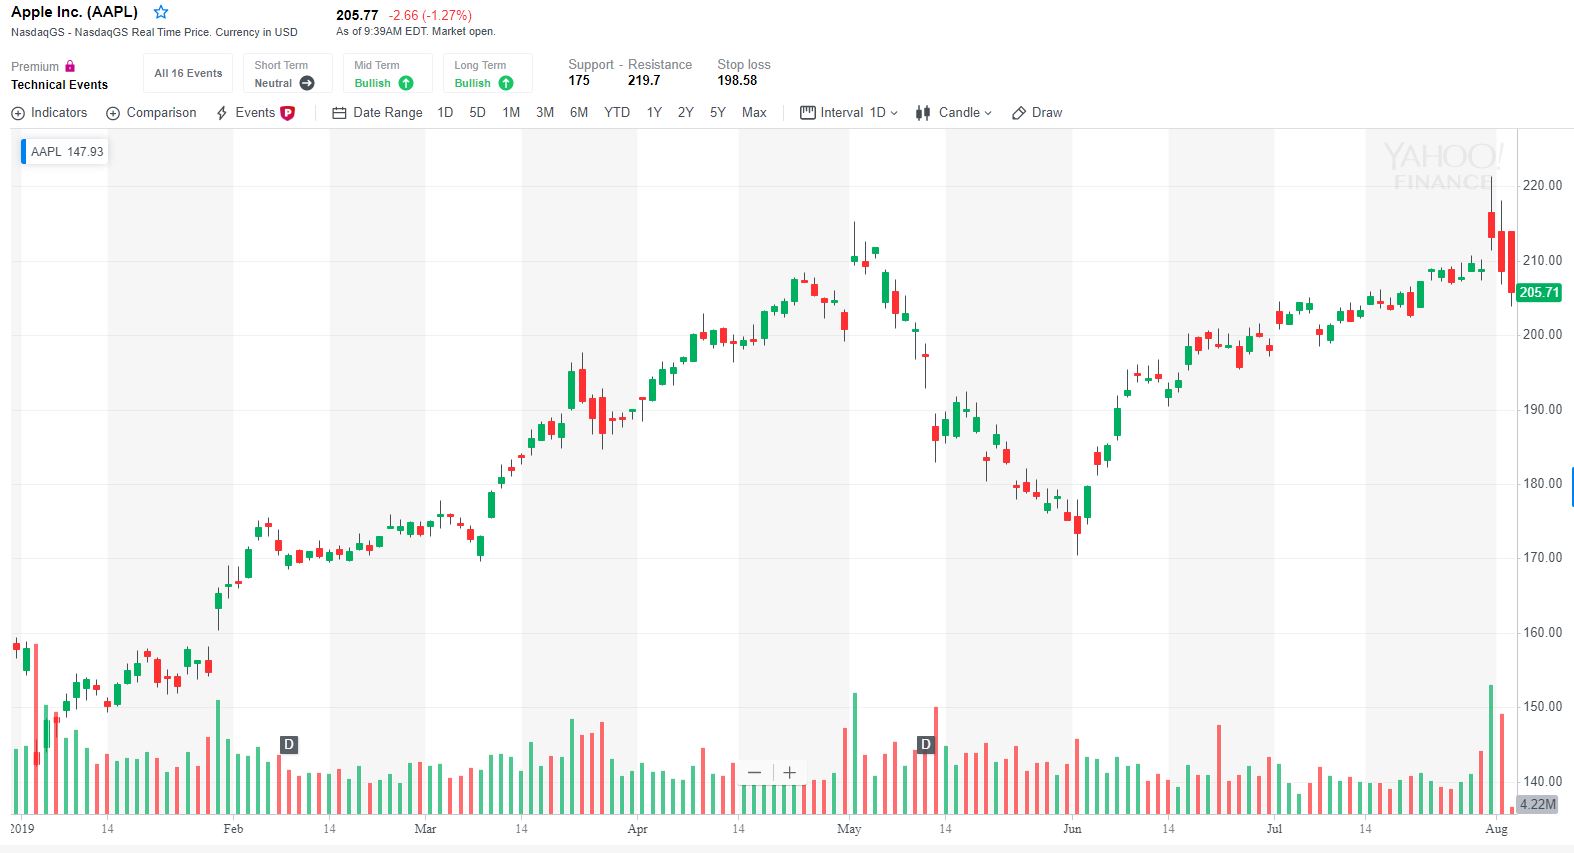
4. Yahoo! Finance
Yahoo! Finance is one of the most popular stock charts. Designed with an intuitive interface, it offers free real-time quotes for NASDAQ listed stocks and the New York Stock Exchange. It also offers free interactive charts together with a selection of more than 100 technical indicators.
Traders have the opportunity of creating an unlimited list of stocks to follow. You can even link Yahoo! Finance to your brokerage account. This will allow you to implement trades based on your sound strategies.
To access more features, try Yahoo! Finance Premium. A 28-day free trial allows you to test advanced features such as:
- Exclusive insights and data
- Advanced charts and tools
- Intuitive data visualization
- Advanced portfolio analytics
- Enhanced charting for technical and event analysis
- Ad lite experience
- Live chat on desktop
Yahoo! Finance Premium is available at $34.99/month or $349.99/year.
Bottom Line
To become a serious trader, you must first learn how charts work. That means familiarizing yourself with trend lines, technical analysis, support and resistance levels. Learning how to use a stock chart software will also enable you to spot winning stocks and trends.