
- My Struggle With Inconsistent Position Sizing
- Why This Became a Problem
- Emotion vs. Data
- Why Not Just Use the Same Size Every Day?
- Why Setup Quality Should Guide Risk
- A+ Setups vs. B Setups
- The Flaw in This Thinking
- Why Market Sentiment Can’t Be Measured by Indicators Alone
- Same Setup, Different Outcome
- The Missing Ingredient
- The Danger of Fluctuating Risk Too Much
- How It Can Wreck Results
- What I’ve Experienced Firsthand
- Should You Always Stick to the Same Size?
- The Psychology Behind Position Sizing
- The Emotional Cycle
- The Rollercoaster Effect
- My Takeaway on Position Sizing in Trading
- Conclusion
Watch Full Video Here: How To Manage Position Sizing
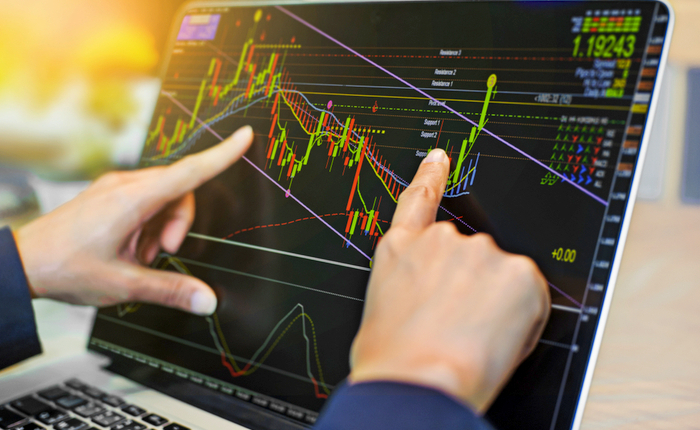
One of the biggest challenges I’ve faced as a trader is figuring out the right position size. Put simply, position sizing in trading is just how many shares you take on a trade. It sounds simple, but in practice, it’s one of the hardest things to get right.
Too small, and you leave money on the table. Too big, and one bad trade can wipe out days of progress.
In this article, I’ll share how I’ve struggled with inconsistent position sizing, what I’ve learned through experience, and why I think consistency is key.
My Struggle With Inconsistent Position Sizing
When I think back on my trading, one theme stands out: inconsistency in my share size.
Why This Became a Problem
On some days, I’ll take it slow, trading 3,000 shares. But then I see a setup I really like, and suddenly, I’m in with 9,000 or even 20,000 shares.
The outcome? If it works, great. If it doesn’t, the loss can completely overshadow the wins. On any given day my share size will fluctuate between 3,000 and 20,000 shares.
Remember, I have been trading for over a decade, and my share sizes reflect that level of experience and the risk I am comfortable taking. Never trade with more money than you can afford to lose, and begin in a simulator. Then, when moving to real money, use a small share size as you gain experience.
Emotion vs. Data
The toughest part is knowing if I’m making those adjustments because of actual market data or because I’m frustrated, emotional, or afraid of missing out. More often than not, it’s the latter, and that inconsistency has cost me.
Why Not Just Use the Same Size Every Day?
I get this question all the time: Why not just pick one share size and stick with it all year long? On the surface, it sounds simple and logical.
Here’s the argument:
- A fixed size, like 3,000 or 6,000 shares, would keep things consistent.
- Wins and losses would balance out over time.
- The approach could help smooth out the ups and downs and prevent emotional swings.
But here’s why I haven’t done it:
- In a cold market, full-size feels like way too much risk.
- In a hot market, using small sizes feels like I’m leaving money on the table.
- That constant push and pull makes it hard to commit fully to one fixed size.
For me, this is the ongoing tension in trading: the desire for consistency versus the fear of missing out on big opportunities.
Why Setup Quality Should Guide Risk
Another perspective that’s helped me is thinking about position sizing in terms of trade quality.
A+ Setups vs. B Setups
The idea is simple: not all trades are created equal. If a setup checks every box — volume, news, chart pattern — it may deserve more size. If it’s a weaker B setup, it probably deserves less.
The Flaw in This Thinking
The challenge is that even the best-looking setups can fail. I’ve seen charts that looked perfect — gapping up, strong consolidation, great pre-market action — and still they collapsed. That’s the limitation of relying on technical criteria alone.
Why Market Sentiment Can’t Be Measured by Indicators Alone
Even if you size based on trade quality, there’s still one factor you can’t ignore: market sentiment. It can make or break a setup, and no indicator can truly capture it.
Same Setup, Different Outcome
I’ve watched identical setups behave in completely different ways. One week, a stock with no news rips 300%. The next week, a stock with great news and a textbook setup falls flat.
The Missing Ingredient
That’s sentiment, and no technical indicator can capture it. It’s either there or it’s not. And if you size up too much on a day when sentiment isn’t strong, you’re in trouble.
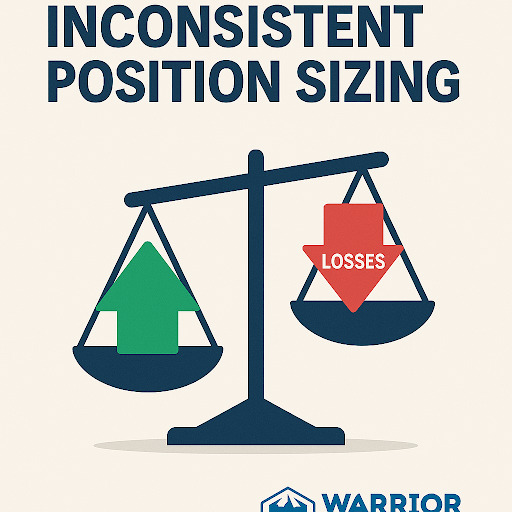
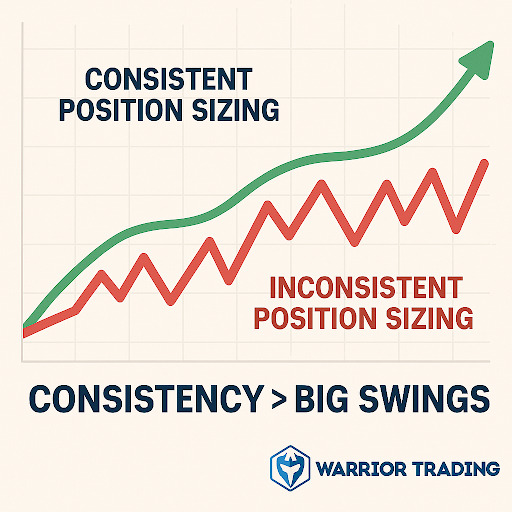
The Danger of Fluctuating Risk Too Much
Consistency in sizing isn’t just about comfort — it’s about protecting your P&L.
How It Can Wreck Results
You can have a 70% win rate and still lose money if your losses are larger than your wins. For example, seven small wins can’t make up for three oversized losses. It doesn’t matter that you’re right 70% of the time — you’ll still lose money if your risk fluctuates wildly.
What I’ve Experienced Firsthand
I’ve had days where 15,000 or 20,000 shares brought in $20,000 of profit. But the same setup, with the same size, on a colder day, led to $15,000 losses. That kind of swing takes a toll.
Should You Always Stick to the Same Size?
So, should I just use the same size every day? It’s a fair question.
There’s a strong case for it: consistency smooths out the rollercoaster, prevents over-leveraging, and forces me to focus only on high-quality setups.
But then there’s the FOMO. If a stock goes up 300% and I only had a small size, I feel like I missed out. That’s the psychological tug-of-war traders face every day.
The Psychology Behind Position Sizing
At the end of the day, this is a technical issue and a psychological one.
The Emotional Cycle
Here’s the cycle I often find myself in:
- Take a big loss: switch to a smaller size.
- Miss a great opportunity: overcompensate with a huge size.
- Repeat the process: inconsistency and stress.
The Rollercoaster Effect
That cycle feels like being stuck on a rollercoaster. Highs feel amazing, lows feel crushing, and it’s exhausting to manage.
My Takeaway on Position Sizing in Trading
What I keep coming back to is this: maybe the answer is to test it.
If I traded a fixed size — say 3,000 shares — for an entire month, I’d have actual data to compare. Would I make less on huge breakout days? Probably. But I’d also avoid the big drawdowns that wipe out weeks of work.
Why does it matter? Trading isn’t just about chasing big wins — it’s about protecting your account and staying consistent long term. Position sizing plays a bigger role than most people realize.
Conclusion
Position sizing in trading is one of the trickiest parts of risk management. For me, the battle is balancing consistency with opportunity. Big size can make your day, but it can also break your month.
The key takeaway is this: stay consistent, avoid emotional swings, and focus on setups that deserve your risk. If you’re serious about building consistency, start by practicing in a trading simulator. That’s how you’ll learn to manage position sizing before risking real money — and why I teach it every day at Warrior Trading.