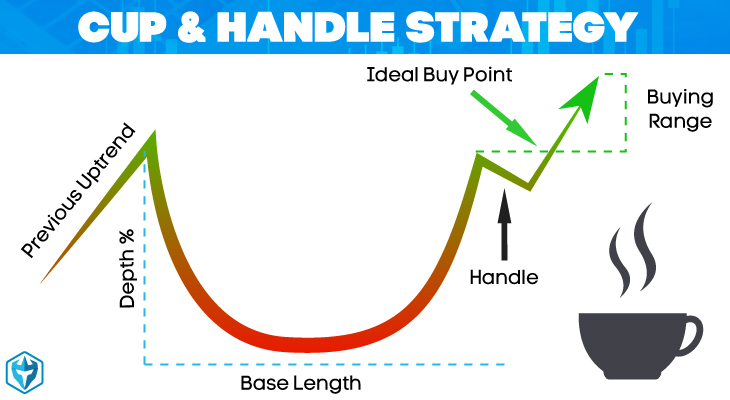
The cup and handle pattern is a continuation chart pattern that looks like cup and handle with a defined resistance level at the top of the cup.

It forms from a strong drive up that pulled back and consolidated over a period of time creating the cup before making another push to the resistance where it pulls back again but not as far creating the handle and then makes it final push past the resistance level and continuing on the trend.
The pattern’s right-hand side will usually manifest in lower trading volumes, and will range anywhere from 7 to 65 weeks. Once the handle downtrend has run its course, the price of the security is expected to make a significant breakout through the resistance level of the previous highs.
The cup and handle pattern develops as a security begins to test old highs, where it will develop selling pressure from investors who bought at these levels. This selling pressure leads to a steady downtrend in prices that can last anywhere from 4 days to 4 weeks before it begins to advance higher again.
How To Trade A Cup and Handle Pattern
To trade using a cup and handle strategy, place your stop buy order a little higher than the handle’s upper trend line. Your order will only execute if the price breaks through the pattern’s resistance.
You might experience some excess slippage and enter into a false breakout if you use an aggressive entry.
As an alternative you can wait for the price to close higher than the handle’s upper trend line, and then place a limit buy order a little bit lower than the breakout level for the pattern, which will execute if the price retraces.
However, you will face the risk of missing the trade if the price fails to pullback and continues to advance uninterrupted.
What To Look For
• Length: In general, a cup that features a longer and more U-shaped bottom will provide a stronger signal. Avoid those cups that have a sharper V-shaped bottom.
• Depth: The ideal cup pattern should not be too deep. Avoid patterns with handles that are too deep as well, since the handles should be forming somewhere in the cup pattern’s top half.
• Volume: The volume should be decreasing as the price declines, and then stay lower than the average seen in the base of the cup. The price should increase as the security starts to move higher toward the previous high.
• The retest at the end of the cup pattern does not need to directly reach the previous high, but the further the top of the handle is from the old high, the less significant the breakout from the handle’s bottom may be.


