There are a lot of different trading patterns out there so we decided to go over in detail what we think are the best day trading patterns.
Best Day Trading Patterns
Out of the many varied ways to utilize technical analysis, chart patterns are perhaps the most utilized and most researched. The reason for this may be entirely organic because the vast majority of strategies in technical analysis require a type of breakout to occur before we can execute a trade.
The most common chart patterns are shapes such as rectangles and triangles.
Chart patterns can be a benefit a curse because every trader has an internal bias that will easily spot patterns that benefit their position, and can unconsciously filter patterns against their position.
Along with chart patterns, we can use Japanese candlestick patterns (both are complementary).
Japanese Candlesticks: Why Day Traders Use Them
Before the late 1990s and early 2000s, most trading and technical analysis material did not use Japanese candlesticks. The chart style traders used for almost 100 years as the defacto chart style was American bar charts.
When Hidenobu Sasaki introduced his groundbreaking work in Japanese candlesticks to the West, Japanese Candlesticks quickly took the technical analysis and trade word by storm, and Japanese candlesticks are now the defacto chart style.
The fact that Japanese candlesticks are now the first chart style that people learn is a bit of a shock to me.
Japanese candlesticks analysis is a very complicated chart form and requires years of practice and learning to not only understand the many varied patterns that exist within this chart form but how to interpret each candlestick pattern with time and volume.
In my opinion, Japanese candlesticks are a phenomenal chart form for analysis, but not the best for trading. I use Japanese candlesticks for nearly 100% of my analysis, but when I am trading and executing live trades, I use Point & Figure.
But Japanese candlesticks, when used correctly, can be a powerful tool in your trading toolbox. Knowing the patterns can help.
Japanese Candlestick Patterns
Japanese candlestick patterns are many and varied. One of the more contemporary works on Japanese candlesticks is the Visual Guide to Candlestick Trading by Michael C. Thomsett (part of the Bloomberg Financial Series).
In Thomsett’s work, there are over 200 candlestick patterns. Good luck memorizing all of them! But for day trading, we need only concern ourselves with some of the most powerful patterns.
Let’s review two of those patterns now.
For this article, I will only be discussing the bullish side of the patterns.
Bullish Hammer Pattern
The bullish hammer is a candlestick where the wick is at least twice as long as the body. There is little to no wick above the body. We want to see this candlestick show up at the bottom of a move.
Why? Because the bullish hammer is a strong indication that a reversal is about to occur. Candlesticks tell a story. The story that the bullish hammer tells us is that sellers are giving up, and buyers are taking over.
Volume needs to confirm this pattern. Volume should be higher than the prior candlestick and is ideally 2x the 20-period volume average.
Note: The color of the hammer candlestick does not matter.
Bullish Engulfing Candlestick
Here it is – The Bullish Engulfing Candlestick pattern. It is arguably the most sought after bullish candlestick patterns. Out of all the single candlestick patterns that exist, none is perhaps more confirming of a bullish move than the bullish engulfing candlestick.
Why is this candlestick sought after by bulls? Because it is the definition of bullish conviction.
Remember: candlesticks tell a story. Candlesticks tell us where price started, how price went, how low price went, and where it finally settled.
The bullish engulfing candlestick shows pure and unquestionable control by the buyers. This pattern almost always results in higher trending prices.
Chart Patterns
In addition to candlestick patterns, day traders seek out powerful trend continuation patterns. Some of the world’s most consistent and profitable traders trade only these types of patterns.
Continuation patterns fall into two categories: flags (rectangles) and pennants (triangles). These patterns are frequent, common, and powerful. Once a new trader can successfully trade these patterns, they are often very close to becoming a consistently profitable trader.
The three most common bullish continuation patterns are Bullish Pennant, Bull Flag, and Rising Wedge.
Bull Flag
A bull flag is a type of rectangle or channel. With a bull flag, we often see it move in one of two ways: horizontally or in a downward channel. The most common is a downward channel.
The psychology of a bull flag is when a prolonged move higher has paused, and it begins to drop. Short traders often enter into this pattern near the bottom of the pattern before the trend resumes.
The reason why we often see price move swiftly higher is that those short traders are getting squeezed out of their position.
A long entry occurs once not at the immediate break of the flag channel. Instead, we wait for a close above the prior swing high (often the last swing high to test the channel). See above.
Bullish Pennant – Ascending Triangle
Where the bull flag is a rectangle, pennants are triangles. Because pennants are triangles, there are more various probabilities based on the type of triangle that develops. For example, the symmetrical triangle has a neutral bias in the direction of the breakout.
The ascending triangle, though, is not only an overwhelmingly bullish continuation pattern; it is also one of the single most sought after bullish patterns that exist.
The ascending triangle forms when there is a flat top with an upward sloping trendline. For traders who are short and attempting to short inside an ascending triangle, this is a very, very painful pattern. During the formation of the pattern, the resistance formed at the flat top convinces more and more shorts that the resistance will hold.
However, the weight of the bulls continues because there continue to be new higher lows.
An aggressive trader may want to enter on the initial break of the flat top of the ascending triangle. Conservative traders may wait for a retest of the break.
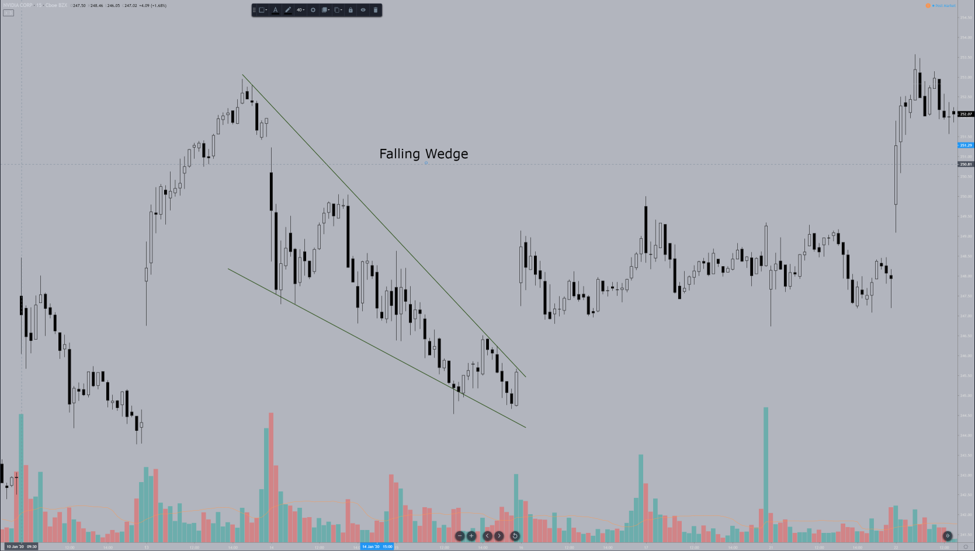
Falling Wedge
A wedge pattern is very similar to a triangle pattern, except the two trendlines to not intersect (at least not at any point soon).
Wedge patterns are associated with a fast descent in price at a fairly steep angle. Wedge patterns are powerful bullish reversal signals and represent low risk and high reward opportunities.
Trading the Bull Flag
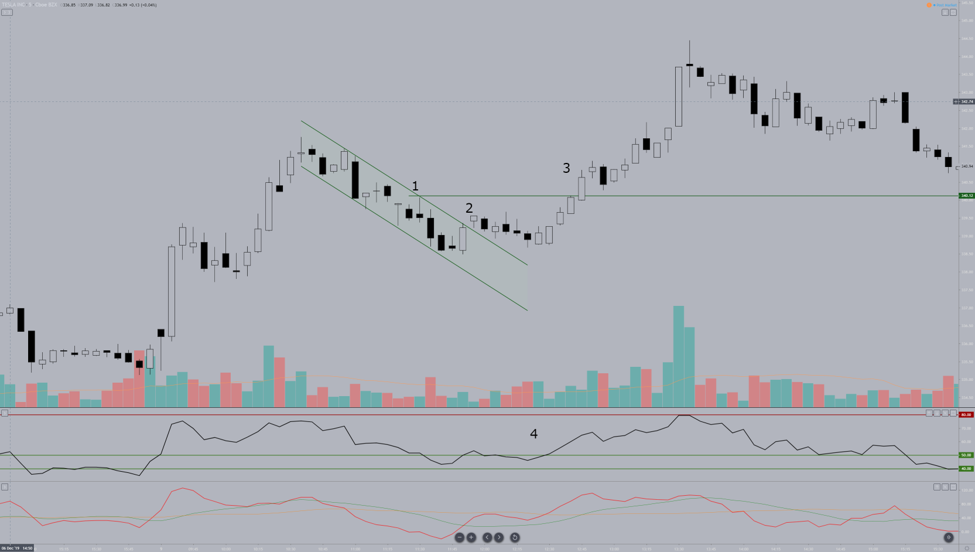
Returning to one of the bull flags on Tesla’s (TSLA) chart, we can see how to approach an entry on the bull flag. #2 represents the first candlestick to close outside of the flag and is an entry the aggressive trader would consider taking.
The more conservative entry here is at #3, where we could enter a long position when the candlestick closes above the level of the second to last swing high (#1) that touched the upper band of the bull flag.
We can further filter the appropriateness of the entry by using volume, the RSI, and the Composite Index. We can see volume rose after the break of the bull flag at #2, dropped a little, and then rose again before the conservative entry at #3.
We want to see volume remain around the 20-period average; otherwise, we could risk several whipsaw price actions that could hit our stops.
#4 is the RSI with the Composite Index below. We can filter for divergence between the RSI and the Composite Index to provide one more check for our long entry. Currently, there is no bearish divergence present at either #2 or #3, so there is very little threat to some immediate downside pressure.
The lack of bearish divergence continues to the conservative entry at #3, letting us know the entry is more than likely safe from any near term downside movement.
Note: Because all of the continuation patterns we discuss involve pullbacks from prior bull moves, the ideal situation we would like to see on the RSI and Composite Index is hidden bearish divergence. It is not necessary, but it is ideal.
Trading the Ascending Triangle
The ascending triangle is one of my favorite continuation patterns. In every single market that I trade, I feel like it is by far the pattern that shows the highest rate of turning into a profitable trade.
Fixed volume markets that are long-biased like the stock market seem to have an even higher success rate with this pattern. Before I get into the breakdown of how to trade this pattern, I think it is essential to understand some of the theory behind triangles in general and how we typically see volume and price react before a breakout.
Chart Breakdown
1. The volume will typically drop before the breakout of a triangle. The drop in volume is your ‘heads up’ that a move is about to happen.
2. The breakout of any triangle often occurs during the last 1/3rd of the triangle. You can use a Fibonacci time tool to divide the triangle up into 33% ranges to help you spot where that division would be if you have a hard to eye-balling the final 1/3rd.
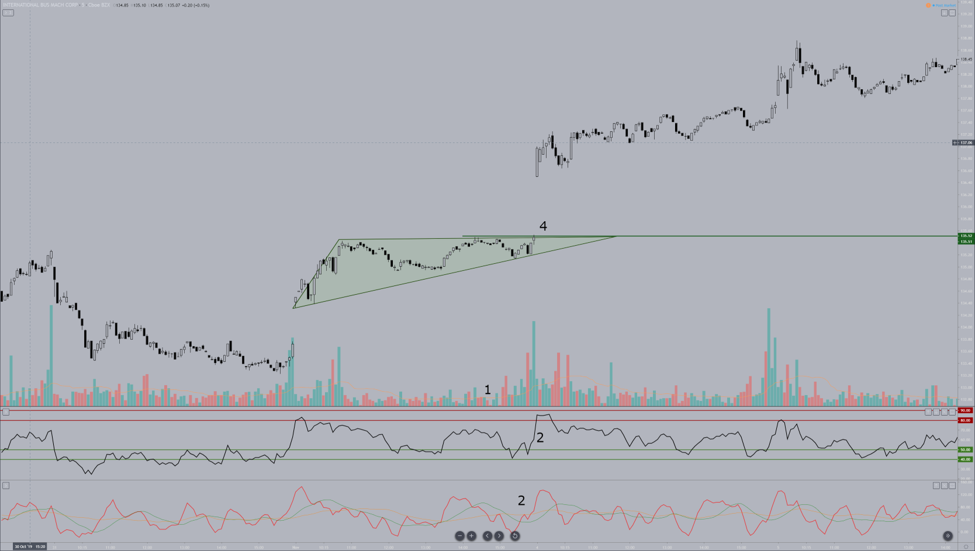
On IBM’s chart, we can see that volume most definitely did drop as we approached the final third of the ascending triangle (#1). Clear testing of the upper trendline of the ascending triangle shows multiple tops have formed, enticing traders to sell or short. Instead, IBM continued to create higher lows.
Utilizing the RSI and Composite Index to help us filter the appropriateness of a buy stop at #4 can help us be confident in our decision. Again, we look for any hints of bearish divergence that would indicate any move above the ascending triangle could be a bull trap. No bearish divergence exists between the RSI and Composite Index.
Instead, there are two bullish signals that the RSI and Composite Index generated. First, is the RSI crossing above the first oversold level at 40 (#2)? The second bullish signal is when the Composite Index line crosses above the slow average (orange moving average, #2).
Both of the bullish signals occur right as price is testing a break of the ascending triangle, giving us a very nice setup for a long entry.
There’s a stock trading maxim that says pro’s trade the close, and amateurs trade the open. I have mixed feelings on how relevant that adage is in today’s markets, but trading the end of this daily session with a buy stop at #4 would have yielded an excellent return on the gap open the next day.
Note: I debated whether or not to use the image above as an example of how to trade the ascending triangle because it looks just too good. However, culmination moves of ascending triangles at the end of the day often do result in large gap ups on the next trading day.
Trading the Falling Wedge
Wedge patterns are just awesome and are one of the best day trading patterns. Rising wedges in the stock market are a mess with the 11+ year bull market – but falling wedges? Falling Wedge patterns are fantastic in perma-bull markets.
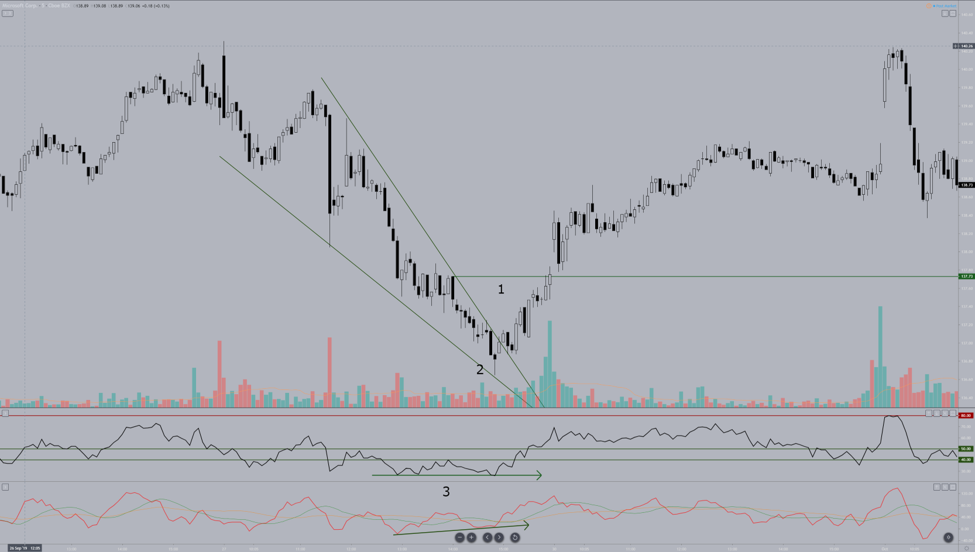
On Microsoft’s (MSFT) chart above, we can see a great example of a falling wedge. Notice at #2 the candlestick pattern – it’s a hammer candlestick. Now, you’ll remember I said that volume should be checked to confirm that the hammer pattern is valid.
The volume is, technically, higher than the past 20-period average and higher than the prior candlestick, but we can see it fall from then on.
In the stock market, volume is essential, but we need to be aware of the time of day. This hammer pattern shoed up just before 1500 EST – one hour before the market close. We typically don’t see a ton of activity until closer to the close of the market. It’s not unusual to see lower than average volume where the hammer pattern shows up.
Just like the ascending triangle, the entry is not at the initial break out of the wedge. I always wait for a close above the second to last swing high that test the downtrend angle. #1 on the green horizontal line represents that level.
We can have further confidence in our long entry by looking at the RSI and Composite Index.
A condition that has been lacking in our previous two trend continuation pattern examples is evidence of divergence. This time, we can see a clear bullish divergence between the RSI and the Composite Index.
The bullish divergence occurs when the RSI is showing flat or lower lows while the Composite Index shows higher lows. Bullish divergence warns us that the downside pressure could end very quickly.
The combination of the bullish hammer pattern along with the bullish divergence creates a solid condition for a long entry if and when price breaks the prior swing high at #1.
Bottom Line
Identifying trend continuation patterns like the ascending triangle, bull flag, and falling wedge create powerful trading opportunities.
Getting used to taking trades with these classic pullback patterns can help you build confidence in your trading and put you years ahead of your peers.
Let us know what you think are the best day trading patterns in the comments below!


