When we hear “stock index,” we usually think of the S&P 500 or Dow Jones Industrial Average, and rightly so.
Many prominent hedge fund managers refer to the S&P as their benchmark, and financial media like CNBC and Bloomberg discuss “the market” in terms of how these indices perform.
But, did you know there’s a lesser-known index that Warren Buffett uses to gauge the performance of the “total market?”
It’s called the Wilshire 5000.
The Wilshire 5000 is a market cap-weighted stock index with roughly 3,400 U.S. based companies. The index aims to represent the entire US equity markets–from tiny $1M companies to $2T goliaths like Apple (AAPL).
How Many Stocks Are in the Wilshire 5000?
This might seem obvious, but it’s not. Despite the name, the Wilshire 5000 doesn’t contain 5000 stocks.
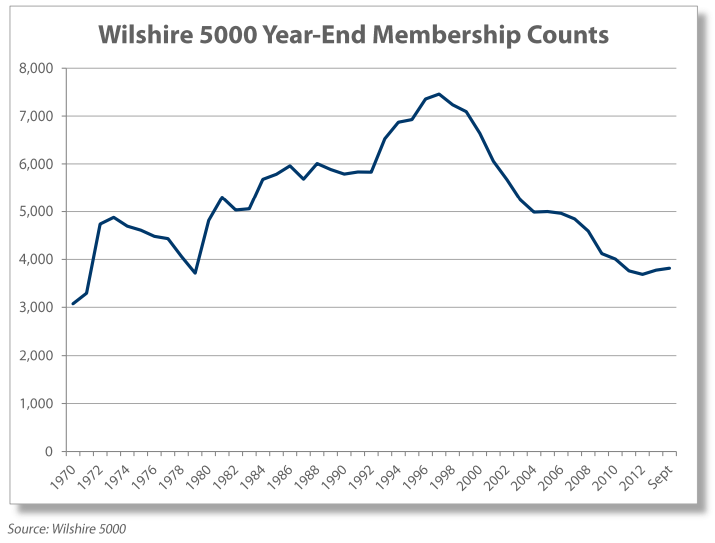
The index currently contains about 3,400 stocks at the time of writing in September 2020. The name comes from the fact that the index had roughly 5000 components at the time of development in 1974.
Unlike the S&P 500, which targets an index of precisely 500 companies at a given time, Wilshire allows the number of components to fluctuate with market dynamics.
This fluctuation is by design, as the Wilshire is a “total market” index, meaning its composition should roughly correspond to that of the entire US equity market. If Wilshire set arbitrary guidelines on the number of issues in their index, it wouldn’t accurately reflect the stock market.
As demonstrated in the above graph, the number of issues in the Wilshire 5000 has been on the decline since the late 1990s.
Around that time, the private financing market became more favorable to smaller companies seeking venture capital. Rather than raising capital on the highly regulated and expensive stock market, many companies opt to raise capital from private equity firms.
What is the Ticker Symbol for the Wilshire 5000?
The Wilshire 5000 isn’t included in many charting platforms, unfortunately. Despite being a nearly pure representation of the stock market, the index never reached the same ubiquity as the S&P 500 or Dow.
Here’s a few ticker symbols:
- W5000: ThinkOrSwim
- ^W5000: Yahoo Finance
- WFIVX: Morningstar
- W5000<index>: Bloomberg Terminal
- us;W5000: Reuters Station
In Wilshire’s fact-sheet on the index, their suggested ticker symbols is W5000, so try that in your charting platform first.
Wilshire 5000 vs. Other Indices
Great, another index, who cares, right? You may be correct in disregarding this index. However, it does have some significant analytical benefits when compared to the other prominent indices.
First, let’s list off the popular US indices and describe their purpose:
- S&P 500: Market cap-weighted index of roughly 500 US-based large-cap companies. Components must be profitable and reasonably liquid.
- NASDAQ 100: Market-cap-weighted 100 largest and most active ex-financial Nasdaq-listed stocks.
- Dow Jones Industrial Average: Price-weighted index of 30 mega-cap Us-based companies. Selection is qualitative and based on factors like reputation, growth, and investor interest.
- Russell 3000: Market cap-weighted index comprising 3000 of the largest US-based companies. Consistently represents over 90% of the US equity market.
Of the “big three” indices: S&P 500, NASDAQ 100, and Dow Jones Industrial Average, the Wilshire 5000 is very different.
To start, the former three are all large-cap indices, which aim to capture the largest slice of the stock market, as opposed to the Wilshire, which seeks to capture the returns of almost the entire stock market.
Does this matter?
Quants and academics disagree, but at a base level, large-cap stocks as an asset class have less volatile returns in contrast to the returns of small and micro-cap stocks, which have a larger standard deviation of returns.
Read more on the size factor here.
This brings us to the Russell 3000, to which the Wilshire 5000 is very similar, with the only key difference being the “total market” characteristic.
The Russell 3000 aims to capture the returns of the 3000 largest US stocks, while the Wilshire 5000 aims to capture the entire US equity market’s returns, regardless of the number of issues.
Warren Buffett and the Wilshire 5000: The “Buffett Indicator”
Warren Buffett isn’t much of a macro, top-down guy. But even he needs some big-picture view of where the valuations of the US equity market are.
His preferred method is a ratio of the market capitalization of the Wilshire 5000 and United States gross domestic product (GDP). He says “it is probably the best single measure of where valuations stand at any given moment.”
Because the Wilshire 5000 represents more than 99% of the US equity market, the indicator can be more accurately called the “stock market-to-GDP” ratio.
If you’re wondering, here’s where that indicator stands today, in September 2020:
How To Invest in the Wilshire 5000
You can’t directly invest in an index because they’re just calculations based on the underlying components. You can, however, invest in funds that attempt to mimic the index composition.
You basically have two choices here:
- The Wilshire 5000 Index Fund (WFIVX): this is a mutual fund managed by Wilshire themselves. The expense ratio is 0.63% for individual investors, though, which is quite high by modern standards.
- The Vanguard Total Stock Market ETF (VTI): this is a very similar “total market” index fund with roughly 3,500 components at the time of writing, making it quite similar to the Wilshire 5000. It’s not based on the Wilshire, however. The expense ratio is much lower at 0.03%.
Bottom Line
The Wilshire 5000 index is just another index, and it’s tightly correlated with the movements of any of the big indices you hear about on TV.
However, I think it’s important to distinguish between a “style” index like the S&P 500, which has criteria chosen by the companies who created them, and a more pure, total stock market index.


