When I started trading stocks the first thing I was researching was how day trading penny stocks works.
Since I didn’t have much money, I thought the only way I could make a decent profit was by trading penny stocks.
Soon after visiting a few websites and signing up to newsletters I was getting daily emails for the next “hot” penny stock. Some of the first trades I took were on penny stock trades priced between 10 and 20 cents per share.
Unfortunately I never found much success trading literal penny stocks (stocks below $1.00).
In fact, I lost over $15k in just 1 penny stock trade which was a nearly 80% trading loss.
It was the biggest percentages loss and 2nd biggest dollar loss I have ever experienced in my career as a trader. During my first 18 months of trading the markets I lost over $30k in rookie mistakes.
I got burned because I didn’t understand how to identify good penny stocks to trade.
If I had been lucky enough get some basic training before I started, my first 18 months could have been completely different. I might have been able to save myself tens of thousands of dollars in losses, and I likely would have been able to make a full-time living a day trader much sooner.
Although I can’t time travel back and make my learning curve faster, I can share my tips with you today!
These tips are based on my track record of trading penny stocks.
Why Should You Listen To Me?
I’ve been consistently profitable for years! Check out my latest verified earnings that were audited by a third party. This shows that I know what I am talking about and can back it up with my earnings statements.
Penny Stocks are Stocks Trading Under $5.00
Before going any further, I want to make sure we are all on the same page regarding the definition of penny stocks.
According to the Securities and Exchange Commission (SEC), Penny Stocks are defined as stocks trading under $5.00 per share (see definition here).
Most penny stocks trade on the Over-The-Counter Bulletin Board (OTC) exchange, meaning they are not listed on NYSE or NASDAQ stock exchanges, but still are required to file with the SEC.
As you can imagine, getting listed on NYSE or NASDAQ is a process filled with tremendous amounts regulation and financial oversight. If a stock listed on NYSE or NASDAQ exchanges fails to maintain compliance, they can face delisting and be moved to the OTC exchange.
Other stocks may never be able to achieve NYSE or NASDAQ listing, and instead trade solely on the OTC exchange.
Investors Should be Cautious
Investors should be aware of four cautions.
First, most OTC stocks do not meet the minimum requirements for most exchanges and do not file with the SEC. Therefore, credible and reliable fundamental data are not available for analysis.
Second, historically Pink Sheets stocks are penny stocks and are often near-insolvent companies.
Third, some stocks are illegitimate shell companies set up to scam investors by issuing press releases, and having “analysts” promote the stock and issue more worthless shares.
Fourth, Pink Sheets only has one requirement for a company to list – a company needs to have one market maker quoting its stock. The listing companies do not have to provide any financial information at all. – Investopedia

Profit Loss Ratios Graph. Understand your odds for success!
If the OTC exchange is 1 step below the NYSE or NASDAQ exchanges, then the Pink Sheets are 1 step below the OTC exchange.
Pink sheet penny stocks are at the bottom of the barrel, the end of the road, the lowest of the low. These are, generally speaking, the worst stocks on the market.
This may be because Pink Sheet listed companies face no requirements to be listed. The means almost any company could become a pink sheet penny stock. These are the stocks that are usually subject to penny stock promotion.
This is when the company or a group of traders pay for a stock awareness agency to promote their company.
Once the price goes up, they sell and take profits. This is manipulation and it’s illegal.
There are traders who even while knowing the stock is being manipulated will still attempt to profit from the volatility. There is a high level of risk here because the SEC can halt these stocks at any time pending investigation.
During a stock halt you can’t buy or sell. You are stuck. By the time the stock resumes trading the promoters will have likely taken their profits and those still holding the stocks will be beginner traders (I was one of them on more than 1 occasion).
If you want to trade penny stocks, you have to do it the RIGHT WAY, and that means avoiding the Pink Sheets.
Trading Penny Stocks on the OTC Exchange
Many traders who don’t feel comfortable trading pink sheet stocks will still trade penny stocks on the OTC exchange. I personally don’t. I have a three distinctive problems with trading on the OTC Exchange.
OTC Exchange & Poor Liquidity
The first is liquidity. Most OTC stocks are very thinly traded, meaning there will be big spreads between the bid price and the ask price. It wouldn’t be uncommon to see a stock quoted at 3.00 x 3.60.
That means there is more than 20% in the spread. If you buy on the ask, you are immediately down 20% if you sell on the bid. This type of spread stacks the cards against you and makes it harder to be profitable.
According to the SEC, “Penny stocks may trade infrequently, which means that it may be difficult to sell penny stock shares once you own them.
Because it may be difficult to find quotations for certain penny stocks, they may be impossible to accurately price” (SEC). Lack of trading volume is what causes the liquidity issues and creates the large spreads and difficulty buying and selling.
OTC Exchange & Poor Execution Speed
My second issue with OTC stocks are the execution speeds. With NYSE and NASDAQ listed stocks execution speeds are typically 1 second or faster.
With OTC stocks, the executions can take as long as 10-15min for orders to fill. This is especially true when tens of thousands of traders are all trading the stock at the same time.
The result is that by the time your order goes through, the price could be dramatically different from when you first placed order.
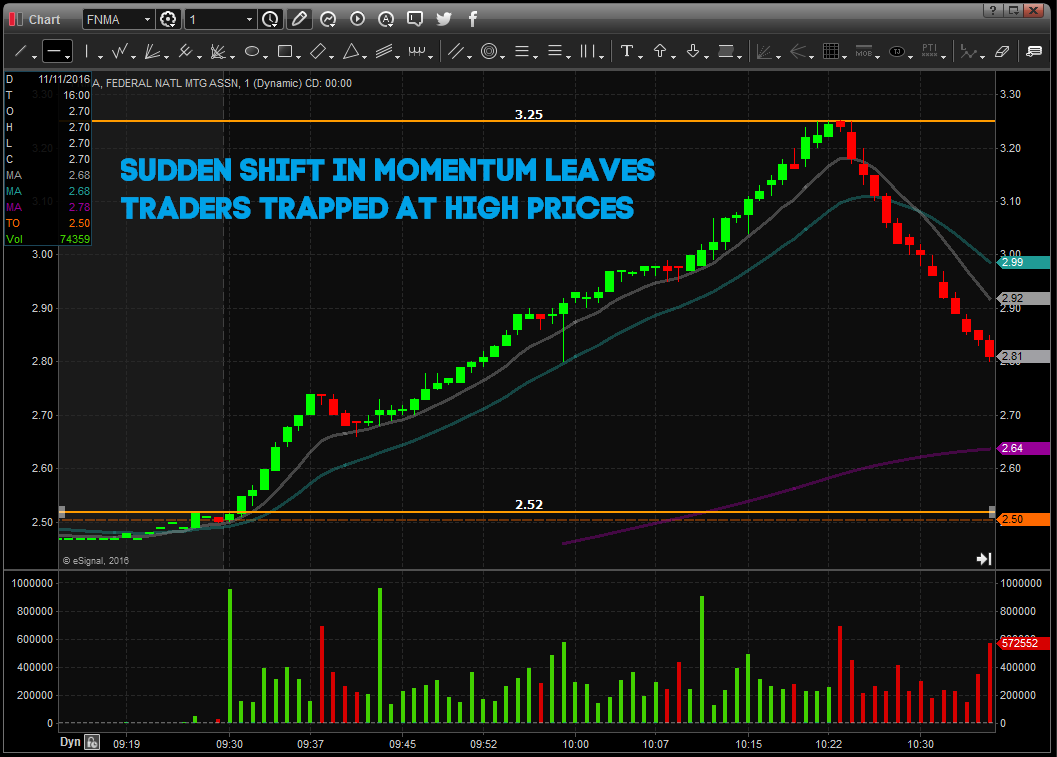
This level of risk in acceptable for me. In the chart below you can see a OTC Penny Stock $FNMA (OTC) that surged up from $2.50 to $3.25 for a 30% intraday move.
The momentum suddenly shifted at the top and buyers who entered too high would have been trapped, and may have had to wait some time before their executions went through and they were able to exit positions.
Over the course of 15min the price dropped from $3.25 back down to $2.80.
OTC Exchange & Pink Sheet Stocks
My third problem with trading OTC stocks is that like pink sheets, they remain high susceptible to stock promoters and manipulation.
This means when the price starts surging up instead of being the result of truly good news, such as a cure to a disease, the catalyst is that fake news may have been circulated by promoters.
Those same promoters will sell the stock once the buying begins. Instead of the supply and demand equation where we have tons of demand and very little supply, those promoters will create supply by selling their shares.
This reduces the likelihood of seeing a good trade for regular traders like myself.
As a trader, my job is to manage risk on every trade I take. I manage risk my avoiding Pink Sheet and OTC penny stocks, and instead focus on trading NYSE and NASDAQ listed penny stocks.

My Step by Step Guide to Day Trading Penny Stocks
Before talking about my trading strategies I wanted to first discuss the risk. Trading penny stocks does carry far more risk than almost any other type of investment.
This risk is multiplied on OTC and Pink Sheet stocks, but is less on NYSE and NASDAQ stocks. I have been able to make a good living trading penny stocks and stocks priced between $5-10.00.
I focus on a very specific set of criteria for how I determine penny stocks to watch. This helps me reduce my risk and increase my profit potential as a trader.
The second step to risk management has been to day trade penny stocks instead of investing. I don’t hold stocks overnight.
I look for penny stocks with the potential to move 20-30% in a single day, and then take as much as I’m able to get before the market closes at 4pm.
When you hold stocks overnight you are exposed to the risk that news could come out overnight and the stock will open tomorrow at a much different price. This happen often with penny stocks as they are some of the most volatile stocks in the market.
Step 1: Trade the Best and Leave the Rest
The first and most important concept to understand is that to be successful as a trader you have to focus on only trading the best quality setups.
As a beginner traders it’s almost impossible to separate good quality from bad quality setups. That’s why I’m going to give you my criteria for finding stocks with home run potential.
I use Stock Scanners to find all of my penny stocks to watch. This makes it extremely easy for me. I have programmed these scanners to only look for penny stocks that match the criteria below.
Each morning I will have a list of stocks I can potentially trade.
Criteria #1: Stocks must be priced under $10 per share.
Criteria #2: Stocks must have a Float (see float definition) of under 100mil shares.
Criteria #3: Stock must have above average relative volume (You can find this using Stock Scanners). This means lots of traders are already starting to buy shares and volume is increasing.
Criteria #4: Stocks must already have started moving up quickly, I usually trade stocks up 10%+ or more with goal of capturing 10-20% of profit.
Criteria #5: Stocks must have REAL news. This is in contrast to fake news put out by promoters. We can find news on Stocktwits, Market Watch, Benzinga, or right in our Day Trading Chat Room.
Step 2: Trade the Best Quality Setups
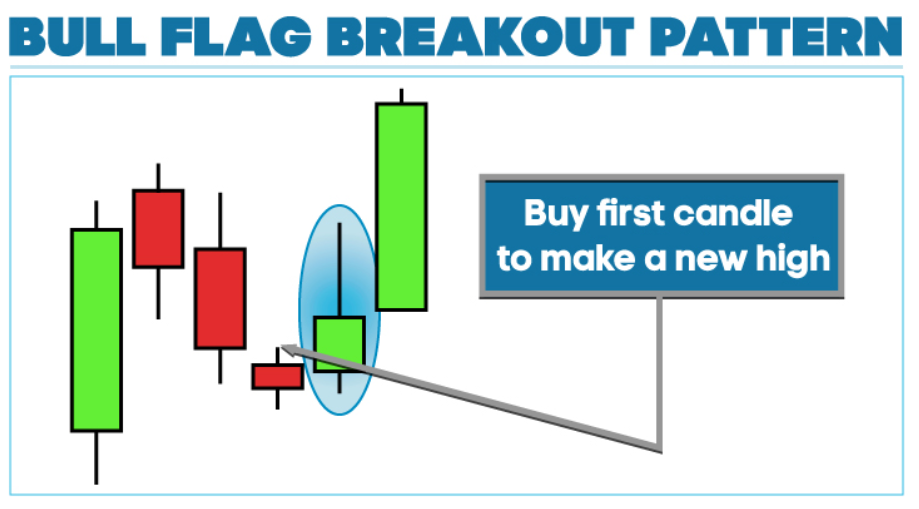
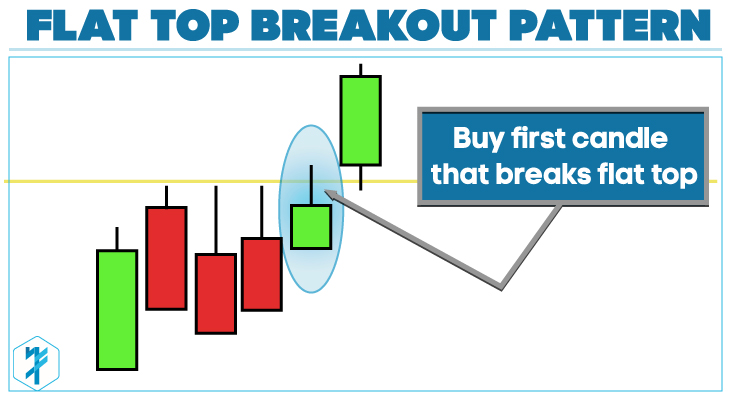
Step 1 is to trade the best quality stocks. Step 2 is to trade the best quality setups. We are going to keep with the theme of Trade the Best and Leave the Rest. The best quality setups are simple Bull Flag or Flat Top Breakout patterns.
These chart patterns are what professional traders use to enter a strong stock with a minimal level of risk. Both of these patterns share some common characteristics.
They both first require a stock to have made a big move up, then pullback with a brief sell off.
At the bottom of the sell off traders take their entry for the first candle to make a new high. This pattern is incredible predictable, and is outlined in great detail as part of my Momentum Trading Strategy.
Remember, these patterns are only valid on the best quality stocks. These patterns are meaningless when they occur in indices, EFTs, or stocks that don’t have high relative volume.
If you are ever in doubt, ask yourself if the stock you are planning to trade is having a once in a year type of event.
On the Bull Flag candle stick chart pattern, the entry is the first candle to make a new high after the pullback.
In the live trading example above, you can see how I took my entry looking for a big move. I was up $2k, but was looking for $4-6k profits. I stopped out with a small winner.
None the less, this was just one of many opportunities I trade each day. I find these stocks on my stock scanners, then wait for the first pullback. Often times I can take an entry after the first pullback and still capture a 10%+ move.
In our Day Trading Chat Room, I call out each of these trades in real-time so our students can see what I’m trading.

Penny Stock Trading Strategies Pattern #1: Bull Flags
 Penny Stock Trading Strategies Pattern #2: Flat Top Breakout
Step 3: Join me and the other Traders in our Chat Room
If you want to be one of the best, you have to surround yourself with the best! In our Day Trading Chat Room we have thousands of active traders exchanging ideas and announcing breaking news.
With this many traders in one room it’s hard for a stock to start squeezing up without one of us seeing it.


