Supply and demand are the underlying forces behind every chart breakout, every failed parabolic move, and each bounce off support and resistance. It’s easy for us to get wrapped in the minutia of the trading world; indicators, backtesting platforms, metrics, etc. But, while these trading tools are undoubtedly useful, they can sometimes serve to […]
Technical Analysis
How to Trade the Shooting Star Pattern
The shooting star pattern is a reversal candlestick pattern. At its core, the shooting star is a failed breakout or “fake out” pattern. Trading this strategy aims to take advantage of the fact that most breakouts fail, and helps you identify some clues of a breakout with a high probability of failure. Throughout this […]
Point and Figure Chart Explained for Beginners
If you are going to actively trade stocks as a day trader, then you need to know how to read charts. Charts are the primary tools for technical analysis. They conveniently visualize the price action by plotting the historical market data of the underlying financial instrument on a graph. This visual representation allows for quicker identification […]
Wyckoff Method Price Action Guide
Stock prices move up and down constantly because of small and large forces. These forces propel prices continuously up and down. If you can identify these forces and make sense of their influence, you can learn to predict stock price movements. The Wyckoff Method is a technical analysis approach to navigating the financial markets based on the study […]
Harmonic Patterns Explained for Beginners
Harmonic Patterns are a type of complex patterns that occur naturally in financial charts based on geometric price action and Fibonacci levels. The patterns were introduced to the trading world by Harold McKinley Gartley in 1932. Gartley created a pattern which he named after himself and outlined in his 1935 book, Profits in the […]
Pennant Pattern For Beginners
Learning to spot technical patterns before prices begin to move is one of the most critical aspects of day trading. Yes, predicting the market with perfect accuracy is impossible, but if you trade long enough, you’ll start picking up on different patterns that could signal an upcoming price movement. Head and shoulders, cup and handle, […]
Support and Resistance Explained for Beginners
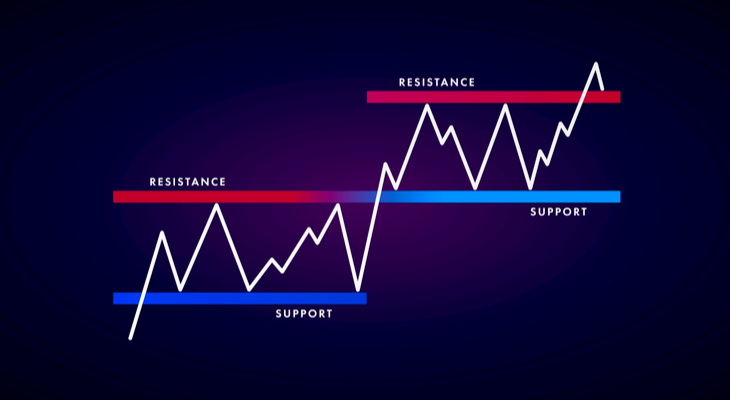
What is Support and Resistance? Support and resistance is a stock market concept which gained steam in the 1800s and early 1900s. The idea is that certain price levels have significant imbalance of supply and demand, and serve as market turning points. In plain English, a support level is a price level where buyers […]
Wolfe Wave Pattern Trading Guide
Predicting market movements with chart patterns is one of the most effective tools for making trade decisions. Chart patterns are pure price-action and the basis of underlying buying and selling pressure. They are formed by support and resistance levels, as well as by more complex versions of trend lines. Patterns have a proven track record, […]
Bump and Run Reversal Pattern
The bump and run reversal pattern is an advanced chart pattern that helps traders spot the end of a trend and the start of a new one. Below we will go over what the pattern looks like and tips on how you can trade it. What is the bump and run reversal pattern? The […]
How to Trade the Evening Star Pattern
The Morning Star might have unpleasant Biblical connotations, but it’s an important bullish pattern for day traders to look for. The Morning Star is a signal that a downtrend could be nearing its end and a reversal to the upside could be on the horizon. On the other hand, the Evening Star is the Anti-bull, […]