Trading is risky, and most day traders lose money. Ross's results are not typical. All information provided is for educational purposes and is not investment advice or buy/sell recommendations. Read our full disclaimer.

Technical Analysis

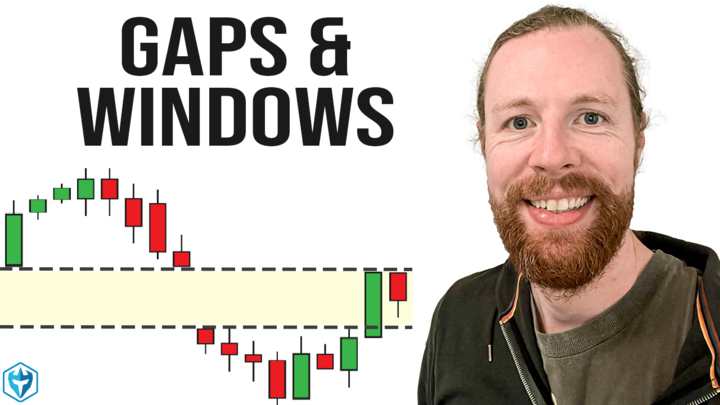
Day Trading Gaps and Windows

All right, so in this episode we’re going to talk about gaps and windows on both daily charts and intraday charts. Get the Micro Pullback Strategy PDF download and more free gifts here This again is another episode in this multi-part series on technical analysis and how to read stock charts, especially for day trading. […]

Read more
Megaphone Pattern

Megaphone Pattern

Most of the mainstream trading literature is chock full of references to patterns with funny names, like the megaphone pattern. To novices looking to learn the ropes, this can come off as a practice in reading tea leaves or moon cycles. And while the trading world admittedly has its fair share of quacks, the purpose […]

Read more
Candlestick Shadow

What is a Candlestick Shadow?

A candlestick shadow represents the extremes of where the price visited during the life of a candlestick on a chart before closing at its ultimate price. On a bullish candlestick, the shadows represent the difference between the closing price and the high price (upper shadow), and on a bearish candlestick the shadow represents the difference […]

Read more

How Technical Traders Can Benefit From Quantitative Analysis

Technical trading is such a diverse method of trading that you really can’t pigeonhole it. There’s trend traders, mean reversion traders, breakout traders, and pullback traders. You can trade support and resistance levels, forecast volume and volatility, or even do technical analysis on the VIX or the Federal Reserve’s balance sheet (maybe that’s not a […]

Read more
island reversal pattern

Everything About the Island Reversal Pattern

The Island Reversal Pattern is a chart pattern that involves a gap in price, consolidation and then another gap in the opposite direction (creating an island of candles as you’ll see in the below charts). Intro In their attempt to understand the movement of prices in different financial markets, pioneers of technical analysis techniques have […]

Read more