What Happened in the Stock Market Last Week?
Price Action
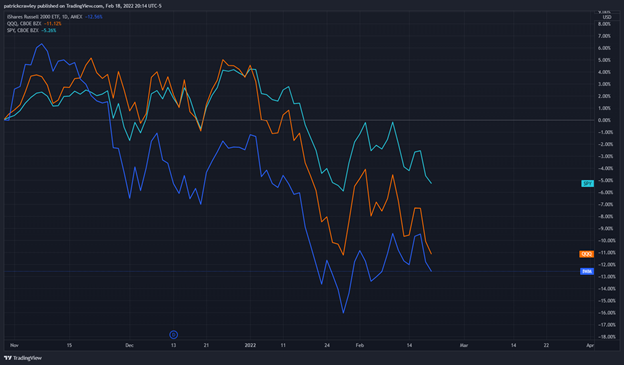
Performance-wise, the NASDAQ 100 is down 1.71% for the week, the S&P 500 is down 1.58%, and Russell 2000 is down 1.03%.
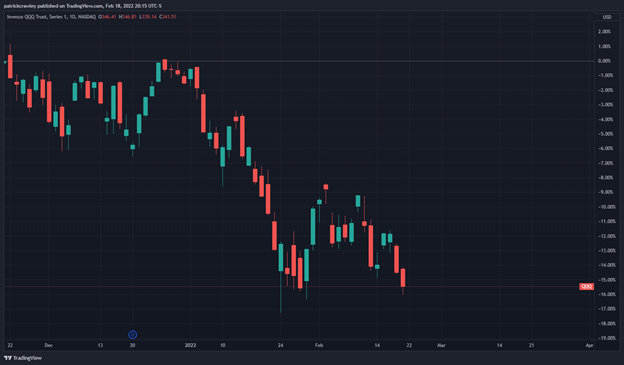
The three main US indexes: S&P 500 (SPY), NASDAQ 100 (QQQ), and Russell 2000 (IWM) are all at crucial levels right now.
The relative underperformance of the QQQ and IWM against SPY is telling of the current weakness present in long-duration growth stocks and small-caps which are more hurt by reflation and rising interest rates, compared to “real-economy,” value-oriented blue chip stocks which are overrepresented in the S&P 500.
When comparing index price action, the core ideas of Dow Theory are good tools to apply and one of them is that when the market leader is making a move, the other index should confirm it. The market leader for nearly the entire bull market so far has been the QQQ, by a wide margin, and we’re seeing QQQ hang around its lows, with little evidence of buyer support forming.
Should we see a breakdown of that crucial low in the QQQ, we would like to see a corresponding break in SPY as confirmation.
Drama in the Ukraine
Tensions between the US and Russia are escalating. The US State Department is accusing Russia of planning an invasion of Ukraine. The US doesn’t like this because they’re a part of NATO, or the North Atlantic Treaty Organization, which is a military alliance made up of dozens of countries and led by the US.
Russia wants guarantees that Ukraine won’t join NATO, and Ukraine wants to join NATO, which would benefit the US as it would strengthen NATO.
As a result, two of the three global superpowers are at a standoff right now, which could lead to actual military conflict and the loss of lives.
Tensions just escalated as of Friday evening as Biden said he’s convinced that Russia will invade imminently, within days.
While we’re oversimplifying here, that’s pretty much the crux of it. Ignore the politicization of the event as some sort of personal vendetta Biden has against Russia or vice versa. That type of stuff doesn’t help you gauge the market impact of these events.
Notably, Russia is one of the world’s largest oil producers and one of Europe’s biggest suppliers of natural gas. Military conflict could mean disruptions in shipments or production, which means more energy pain for Europe. If you’ve been following along, Europe is amidst an energy crisis right now, paying out the nose for fossil fuels like natural gas and heating oil. This could make things even worse for them if Russia decides to cut off supply to Europe.
War or military conflict typically means volatility. And volatility leads to a flight to safety, so keep an eye on defensive assets like treasuries, defense contractors, utilities, and consumer staples.
Russian stocks have been selling off on the news, with the volatility of their stocks more than doubling since November 2021:
The potential destabilizing effects to the global economy have also been taking a hit on US stocks, as can be seen in the S&P 500:
Crude started the week with a multi-year high of $96, only to retreat later in the week to close out at $90.21.
Troubles at DraftKings
DraftKings is the market leader in the brand new industry of legal US-based sports betting. The industry is massive and fiercely competitive, with the American Gambling Association estimating that there’s nearly 3,000 online gambling sites.
DraftKings was a huge post-COVID winner, seeing their stock rise from March 2020 lows of $10, to a March 2021 high of $74. Being a well-funded and household name, many chose them as a standalone winner in this new industry and the stock market rewarded them as such with lofty valuation multiples.
But the company has been experiencing significant problems in the last year, just as many of their growth stock peers like Peloton (PTON) and Zoom Video (ZM) have.
DraftKings (DKNG) just reported earnings on Friday the 18th and the stock dropped 21%, with most citing the company’s negative guidance and high customer acquisition costs as the primary reason.
Customer acquisition cost (CAC) is a measure of how much marketing dollars it takes to get a new customer for your company. CAC is directly related to the lifetime value (LTV) of a customer, in other words, how much profit a company projects they make during their time as a customer of a company. Tons of effort is put into figuring out how to get the CAC to a level that is satisfactory relative to LTV, all while ensuring much of that LTV is front-loaded (the customer quickly pays them) to manage cash-flow concerns.
This is the problem DraftKings is having. They’re paying too much in marketing/advertising dollars per customer they attract. You might have suspected this too, as the company’s promotions for new customers have been pretty extreme lately, offering free bets, large deposit bonuses, or betting lines that are extremely favorable to new customers.
The result is that DraftKings’ expenses are rising while their negative cash flow growth is accelerating. This is the opposite trend that a company wants.
Furthermore, the company’s future guidance doesn’t look much better. Remember, the stock market is a discounting mechanism. Companies are valued based on projections of their profits in the future, not currently. Hence, future guidance is all-important and DraftKings disappointed the market. Their EBITDA (think of this as profit before taxes and other non-cash costs) guidance was below the expectations of the market and analysts. Missing expectations as a growth company means big pain.
Other Earnings Moves Last Week
DraftKings was the biggest headline this week, but fellow growth stock Roku (ROKU) made a similar move, dropping 22% on weak guidance to $112, putting the stock down nearly 80% from it’s all-time high of $490. Like DraftKings, it’s yet another lockdown winner experiencing big trouble post-reopening.
Walmart (WMT) got a little bump in its stock price following a pretty positive report for the retail giant. Most notably in the report, Sam’s Club, which is their Costco-like warehouse store, jumped 10.4% in comparable sales.
Earnings This Week
Looking ahead to this week’s upcoming earnings reports, we’re going to hear from home improvement retailers Home Depot (HD) and Lowe’s (LOW), Chinese internet giant Alibaba(BABA), and a handful of retailers like TJ Maxx (TJX), Macy’s (M) and Foot Locker (FL).
Here’s the full list of notable earnings reports for the coming week:
Monday, February 21:
- Market closed for George Washington’s birthday
Tuesday, February 22:
- Home Depot (HD)
- Macy’s (M)
Wednesday, February 23:
- Lowe’s (LOW)
- TJ Maxx (TJX)
- com (OSTK)
Thursday, February 24:
- Alibaba (BABA)
- Anheuser-Busch (BUD)
- CBRE (CBRE)
- Wayfair (W)
- Newmont Mining (NEM)
- Keurig Dr. Pepper (KDP)
- Discovery (DISCA)
- Papa John’s (PZZA)
Friday, February 25:
- Icahn Enterprises (IEP)
- Foot Locker (FL)
Upcoming Economic Data
New Home Sales: Thursday, February 24
The US housing market is still strong, likely driven by a combination of inflation and post-pandemic migration (home buyers are upsizing out of apartments or smaller homes).
Last month’s data showed some YoY weakness in high-priced homes likely as a result of a widespread sentiment that prices are too high. While the real estate market is very hot, it doesn’t have the same “boom” sentiment that led to the housing crisis, which could potentially stall out home price growth.
With that said, home sales are still increasing
Other Upcoming Economic Data:
Tuesday, February 22:
- Consumer Confidence
Thursday, February 23:
- Unemployment Data: Initial and Continuing Claims
- New Home Sales
Friday, February 24:
- Personal Consumption Data: Personal Income, Personal Spending, and the PCE Price Index (measure of inflation)


