 Scanners, Charts, & News included with a Day Trade Dash subscription
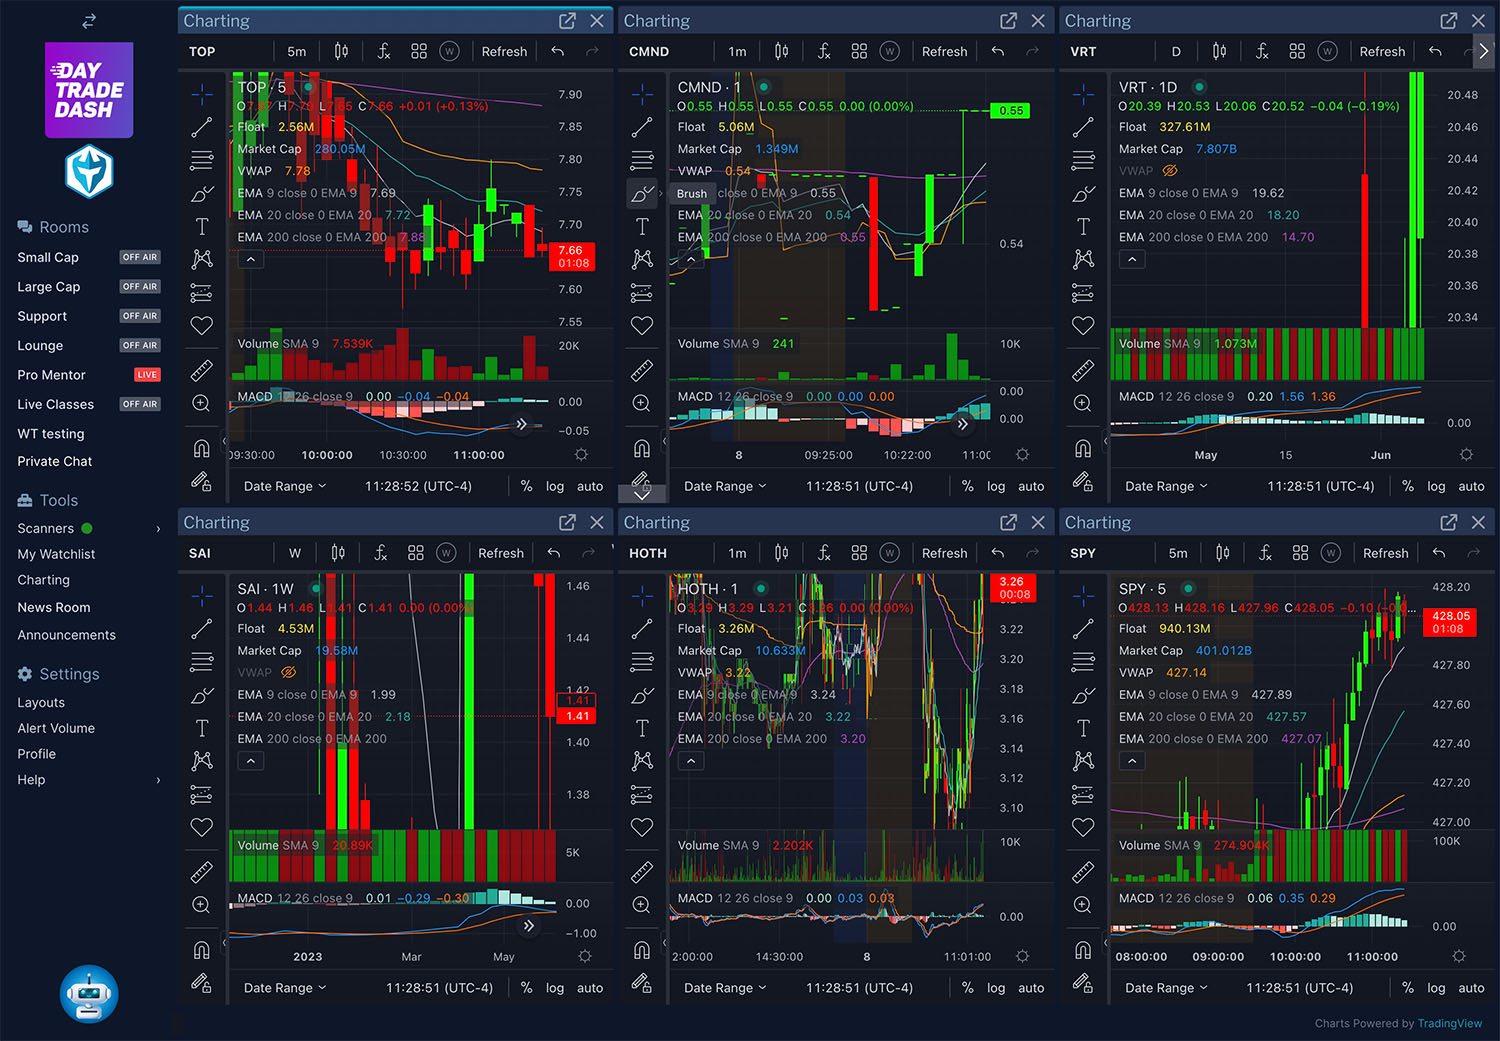
Charts
Now Available on The Day Trade Dash Platform
Learn More About Day Trade Dash
Ready to get started?
Charts for Day Traders
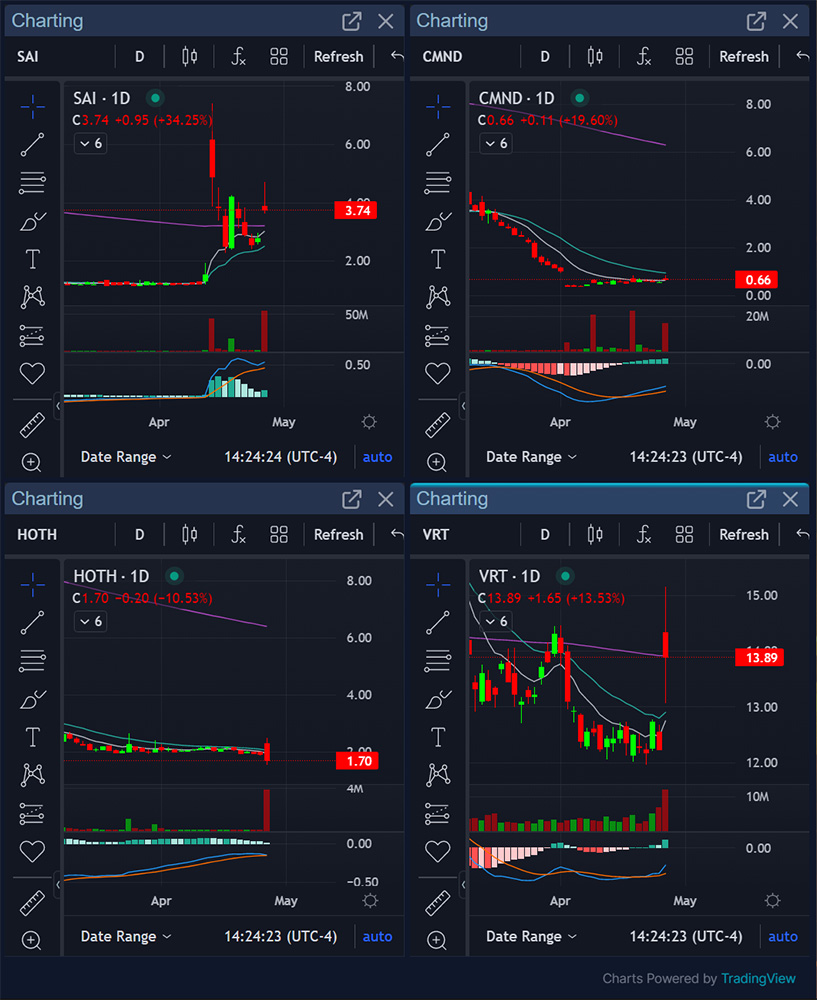
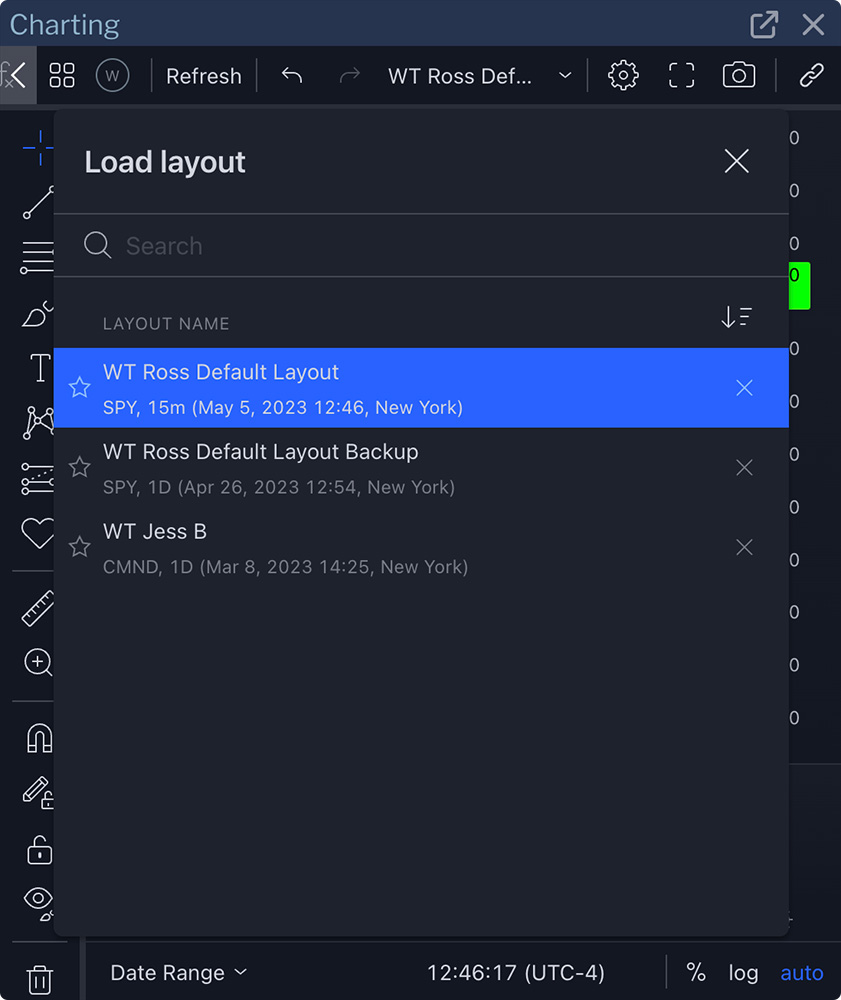
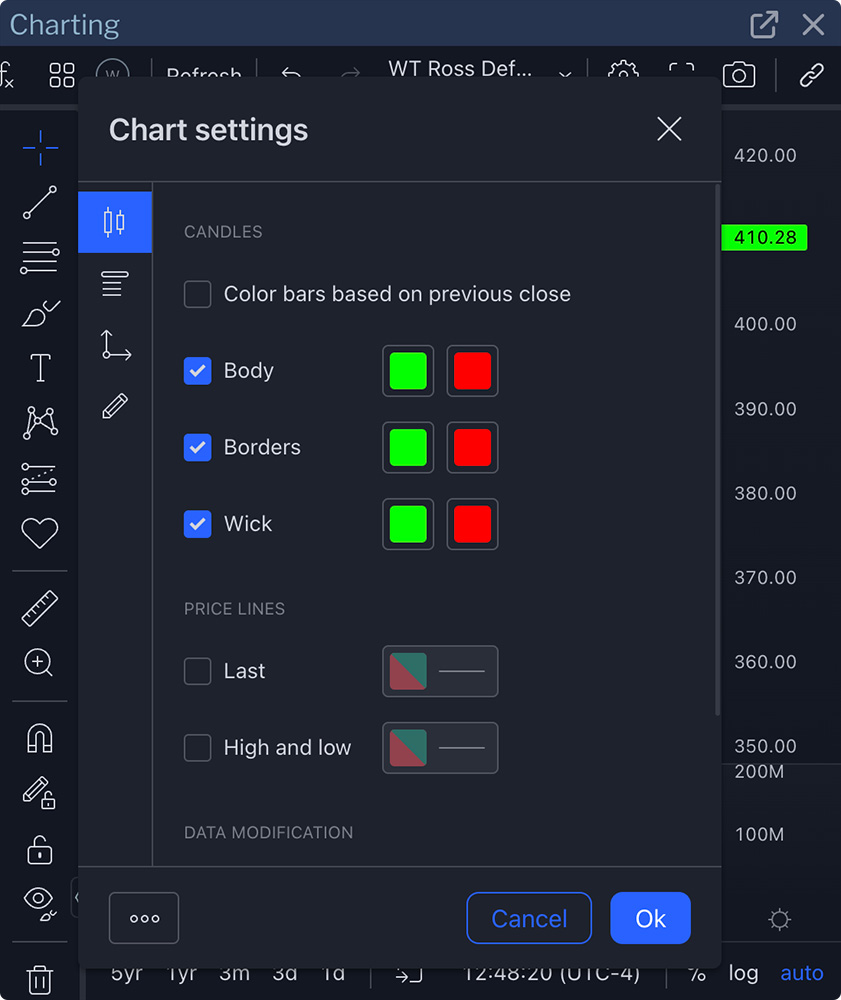
At Warrior Trading, we partnered with TradingView to harness their charting engine as the base framework for our development. We have customized these charts by adding the technical indicators used by our mentors as default settings so new members can sit down and immediately begin looking at the exact same charts as their mentors.
A prime example of our customization is eliminating ADFN orders from our charts. In recent years, market data has become increasingly filled with delayed and erroneous prints. The result is that when these orders are marked on charts, they create candlestick patterns that are incorrect. In order to preserve the integrity of our charts, we filter out delayed and erroneous prints, giving our members the most accurate charts possible.


Ready to get started?
More About Charts for Day Traders
Fundamental Analysis vs. Technical Analysis
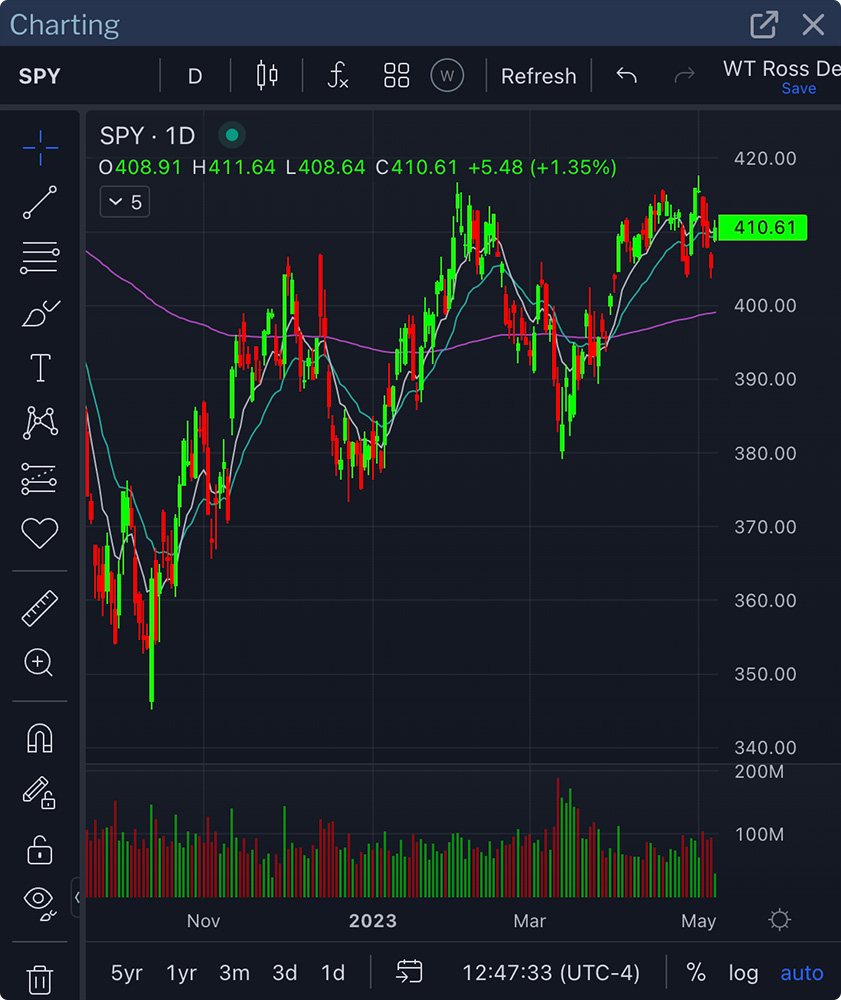
Active traders rely on stock charts to place their trades. Using stock charts is called technical analysis. This is in contrast to fundamental analysis, which is the process of estimating a company's true value and potential value by analyzing financial disclosures, reviewing cash flow, and understanding the growth trends of competitors. Technical analysis relies purely on price action. The various prices a stock trades at become recorded in a stock chart and forms a historical look at the performance of a company's share price.
Learn more in our Technical Analysis Guide.
Utilizing Stock Charts
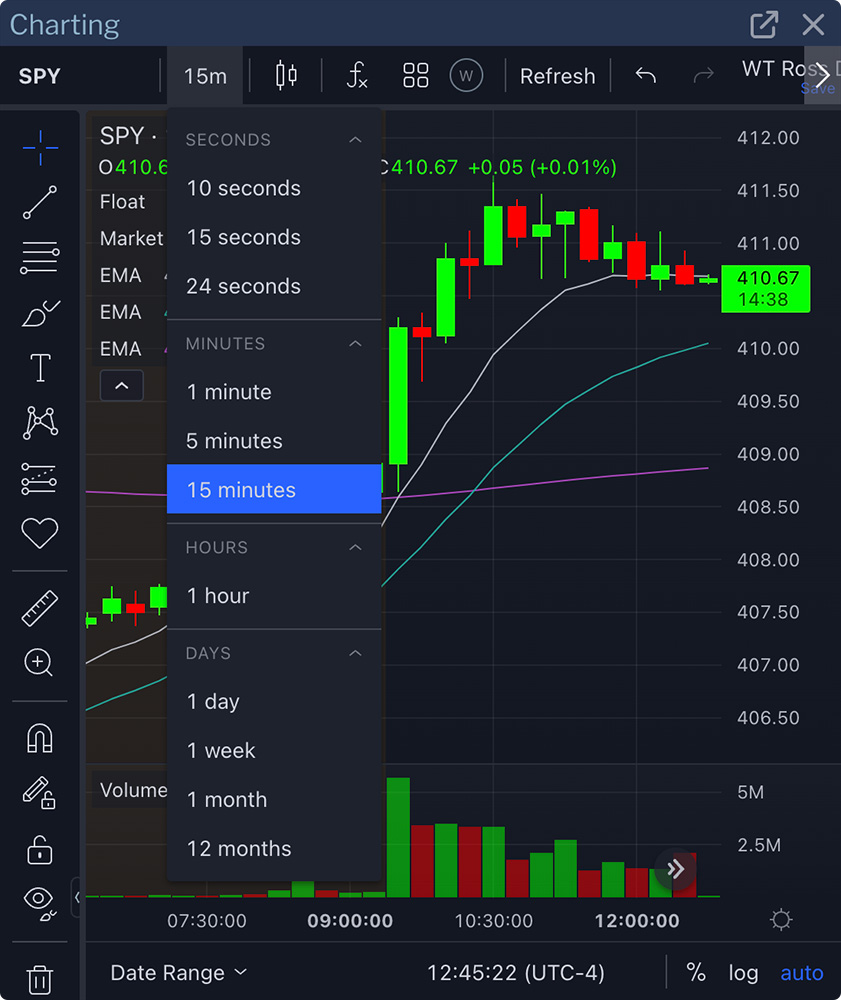
Day traders rely on stock charts to understand historical price action and to predict the future price. Unlike long-term investors who work to predict the price of a stock over the next 5-10 years, day traders attempt to predict the price of a stock over the next 5-10 minutes. These short-term fluctuations in price on volatile stocks are what day traders thrive on.
View our video tutorial on using stock charts.