Pattern recognition is an important part of technical analysis. You want to make sure that if you have a déjà vu moment you can act on a situation if you have seen it before.
When you are evaluating price action using technical analysis you are gauging the ebbs and flows of investor sentiment based on market trends and consolidation.
When prices begin to move sideways, they create patterns that can be used to determine future price movements.
As you begin to recognize different chart patterns, you will learn to determine the difference between patterns that foreshadow a continuation, and those that signify that a reversal is in the works.
One of the most powerful continuation patterns is the three line strike candlestick pattern.
What are Candlesticks?
A candlestick pattern is a group of 2-or-more candle bars. A candle bar is a price bar that describes the information to a chartist that is based on the open, high, low and close for any period you are evaluating.
The origins of candlesticks bars go back to the 17th-century Japanese rice traders eventually making their way to a US version initiated by Charles Dow around 1900.
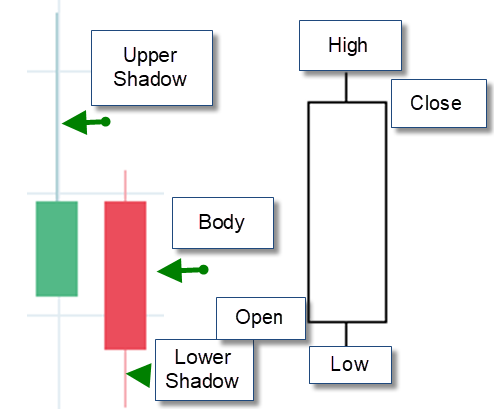
The candle bar describes the open, high low and close. To create a candle bar, you need to have data that contains these 4-data points. The colored (or hollow portion) of the candle is called the body.
The lines at the top and bottom are referred to as shadows, or tails or wicks. The high of the bar is the top shadow and the low is the end of the low shadow.
The left side of the candle where the body end and the shadow begins is the open price.
The right side of the body where the body ends and the shadow begins is the closing price. If an asset closes above the open, the color of the bar is generally green or even hollow. If the open is above the close the body is generally red.
Compared to traditional bar charts, the candlestick charts are visually appealing and are easier to decipher.
Each candlestick bar is visually appealing and describes price action to the extent that you can instantly compare the relationship between the open and close as well as the high and low.
What is a Three Line Strike Pattern?
You can use candlestick patterns to help you determine a trend, that is likely to persist. After prices trend in a specific direction, prices will pause before refreshing higher.
This is considered a continuation pattern and differs from a pattern that would signal a reversal. The three-line strike pattern is considered a continuation pattern.
A bullish three-line strike pattern has several key elements that include:
- Three consecutive periods where the close is higher than the close the prior day
- Three consecutive periods where the low is higher than the prior days low
- Four consecutive periods where the high is higher than the prior days high
- On the fourth bar in the pattern, the low is lower than the low for each of the prior 3-bars.
- On the fourth bar in the pattern, the close is lower than the close for each of the prior 3-bars.
The fourth bar in the pattern is a very powerful move lower (in the case of a bullish three line strike pattern, and completely disrupts sentiment. The reversal of the upward trend occurs within one bar and allows positive sentiment to come back for those who believe the upward trend in the price is still intact.
A bearish three-line strike pattern has several key elements that include:
- Three consecutive periods where the open is higher than the close
- Three consecutive periods where the high is lower than the prior days high
- Four consecutive periods where the low is lower than the prior days lower
- On the fourth bar in the pattern, the high is higher than the high for the each of the prior 3-bars.
- On the fourth bar in the pattern, the close is higher than the close for each of the prior 3-bars.
Pros and Cons of Using the Three Line Strike Pattern
The are several criteria that make up the three-line strike pattern. This pattern does not occur often and has specific criteria that make its occurrence a rarity.
This compares to non-candlestick continuation patterns such as a flag or a pennant that does not have specific criteria to occur to determine that a continuation is occurring.
Generally, the reversal of the trend provides a very good entry point for you to participate in a trend. You can also use these patterns in conjunction with other trend-following tools such as a moving average crossover pattern.
Finding a Three-Line Strike
The three-line strike pattern is a rare pattern which means that using a scan to find them might be useful.
The daily chart shows you the sharp reversal that can be used as a bearish entry point to participate in the downtrend.
Risk Management
The risk management techniques that you can use when you are using the three-line strike entry, should be like other trend-following strategies. The goal is to catch a trend and follow the trend until the trend reverses.
This would mean that you could place a stop below your entry and move it higher as the market trends upward. You can move the stop loss downward for a bearish pattern.
Bottom Line
The three-line strike candlestick chart pattern is a pattern with specific criteria that do not occur often. This pattern is a continuation pattern that is a pause that refreshes higher and helps identify a consolidation in a trend.
This differs from a reversal pattern that generally points to changes in a trend. You can use the three-line strike candlestick pattern in conjunction with other trend-following studies such as a moving average crossover study.
Before entering a trade based on a three-line strike pattern, make sure you have a prudent risk management strategy in place.
Since the pattern is focused on finding a trend, you can use a trailing stop loss that moves up (or down) as prices trend higher (lower).
The pattern is rare so it can be helpful to use a scanner to identify three line strike patterns for you.


