

What is Market Profile
Market profile displays all of the volume executed at each price level as opposed to normal volume indicators which displays volume based on time.
It allows you to more accurately observe the accumulation and distribution of markets, and shows you that each candlestick isn’t created equally. Some prices see significant volume, while others trade thinly and are either accepted or rejected quickly, settling back into the “value area.”
How it Started
Market profile isn’t another redundant technical indicator developed by an opportunistic programmer. It was created out of necessity. The technique was developed by CBOT trader J. Peter Steidlmayer because he aimed to replicate the raw human behavior observed by a trader in the pits.
A key distinction made by market profile practitioners is the idea of a ‘fair’ and ‘unfair’ price. They consider prices within the value area (the range where the majority of volume is done) to be fair prices, while prices above and below the value area are considered unfair.
This approach is quite similar to that of value investors, who come up with an intrinsic value for a company, and will generally look to buy at an ‘unfair’ price, below intrinsic value.
Market profilers are the same way, they establish a range of fair value and try to get into the market at an unfair level. Steidlmayer even mentioned that was heavily inspired by the work of Graham and Dodd on value investing in his development of market profile.
Traders can create strategies based off of market profile, or they can use it to supplement and confirm an existing strategy. Like all trading tools and indicators, nothing is a substitute for a sound strategy with the reward-to-risk ratio skewed in your favor.
Different Market Profiles
There’s volume profile–which displays how much volume was done at prices–and TPO (time-price-opportunity) profiles–which show how much time was spent at prices. Most profile traders use both in conjunction with each other but tend to prefer one over the other.
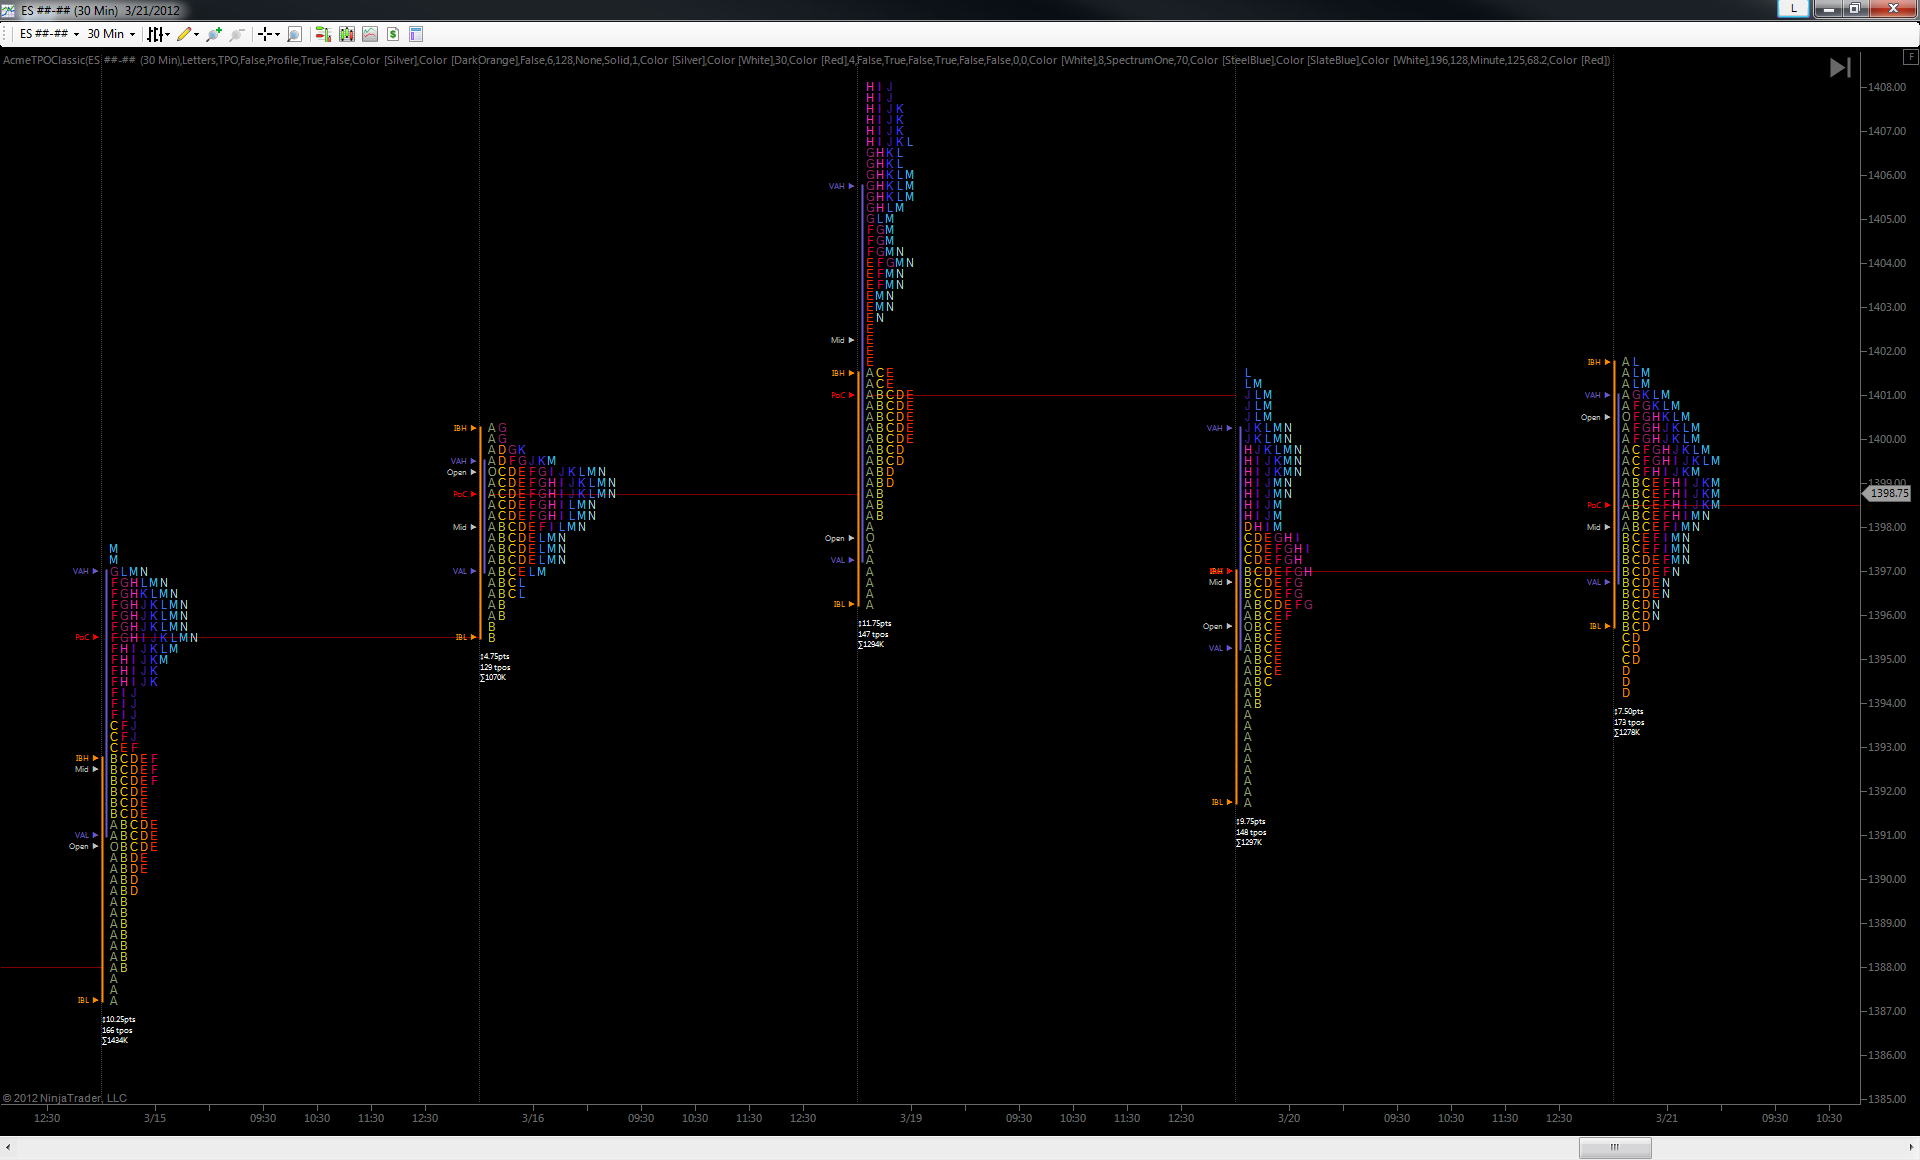
Here is an example of a TPO profile:
And an example of a volume profile:

The Market Is An Auction
Market profile practitioners view financial markets as one big auction. Prices are created through the constant act of humans bidding and offering prices on stocks all day.
Volume is a key component to auction theory: when volume begins to dry up, the price can’t go up or down too much longer. Price wants to go back to a place where trade will be facilitated. The same way an auctioneer will begin to drop the price when people begin buying less, the market cannot maintain a level where trade doesn’t facilitate.
Market Profile: The Bell Curve
Steidlmayer, the creator of market profile, was heavily inspired by the statistical bell curve during his development of market profile.
A bell curve is a distribution of outcomes, where the top of the bell represents the most frequently occurring outcomes, with frequency diminishing as the bell’s height reduces.

Steidlmayer used the concept of a bell curve to organize volume data. Anything within the first standard deviation–the middle of the bell curve–was considered to be the value area. When price deviated from the value area, he saw an opportunity to take the opposite end of the trade (i.e. shorting the market when price went above the value area).

Above is a perfect example of Steidlmayer’s bell curve concept, from his book.
Market Profile Levels
Value Area
The value area is where the majority of volume is being done. This is basically what the market views as the “fair price” in the short term. When price wanders outside of the value area, it is considered to be testing the value area to see if price will break and move into a new value area.
The value area has a high and a low point, which are viewed as similar to support and resistance by market profile traders.
Point of Control
The point of control is a specific price where the most volume has been executed at. Usually displayed as a line like a moving average, the POC gives you quick perspective on where the market’s equilibrium is.
You can view the point of control in a similar sense to VWAP.
Volume Nodes
Volume nodes are peaks and valleys within the volume profile.
- High Volume Nodes
High volume nodes are a large peak in volume at a specific price. They’re seen as a ‘fair’ price for the asset due to the massive agreement between buyers and sellers at that point. When price reaches an HVN, a period of consolidation is likely to follow.
- Low Volume Nodes
Low volume nodes are levels that have seen very little volume done. When price reaches a LVN, the market is more likely to go through a phase of price discovery. Being that the market hasn’t traded at this level yet, the market is more likely to go through that price quickly to try to get back to a ‘fair’ level.
Support and Resistance Market Profile
Market profile makes it remarkably easy to identify support and resistance levels. Instead of looking at static candlesticks, market profile gives you the additional context that tells you where the supply and demand shifts are really taking place.
In the chart below, we identify a rough value area, as defined by the thick red lines. We can see clear congruence between the support levels outlined by the market profile and that which we’d identify solely on a chart.
Around the $98.50 level, there is a large drop-off in volume. Buyers sense that as price gets closer to that level, they’re getting a better than fair price so they buy the market aggressively and a support level is created.

Final Thoughts
Market profiling is an efficient way of organizing the chaos of human behavior by lending us the time and volume context associated with a standard price chart.
With so much randomness already present in markets, most levels that look significant–aren’t. Market profile serves to improve the signal-to-noise ratio just enough to give us an edge.