One of the great things about trading is that everyone can have their own unique style. Even if two different trading styles conflict, it doesn’t mean that one strategy is right and one is wrong.
With thousands upon thousands of stocks to choose from, there’s always an abundance of effective ways to trade.
Technical analysis is often lumped together into one specific style, but not all indicators point in the same direction.
We’re all familiar with commonly used technical concepts like support and resistance and moving averages, along with more refined tools like MACD and RSI.
No single indicator is a golden goose for trading profits, but when used in the proper situations, you can spot opportunities before the majority of the crowd.
One technical trading indicator that tends to fly under the radar is the Fisher Transform Indicator.
Despite its lack of popularity, the Fisher Transform Indicator is a great tool to add to your trading arsenal since it’s fairly easy to read and act upon.
What is the Fisher Transform Indicator?
One of the greatest struggles in market analysis is how to deal with so much random data.
The distribution of stock prices makes it difficult to locate trends and patterns, which is why technical analysis exists in the first place.
Hey, if the trends were easy to spot, everyone would get rich trading stocks and the advantage provided by technical analysis would be whittled away.
But since technical trends are difficult to spot with an untrained eye, we rely on trading tools like the RSI and MACD to make informed decisions.
The Fisher Transform Indicator was developed by John F. Ehlers, who’s authored market books like Rocket Science For Traders.
The Fisher Transform Indicator attempts to bring order to chaos by normalizing the distribution of stock prices over various timeframes.
Instead of messy, random prices, the Fisher Transform Indicators puts prices into a Gaussian normal distribution. You might know such a distribution by its more commonly used name – the bell curve.
Bell curves are usually used to measure school grades, but in this instance, it’s used to more neatly smooth out prices along a specific timeline.
Think of stock prices like players on a basketball team – if you organize everyone in a pattern by height, you’ll have a much better understanding of the makeup of the team.
So what does the Fisher Transform Indicator look for? Extreme market conditions.
Unlike other trading signals where many false positives are delivered on a daily basis, this indicator is designed to pop only during rare market moments.
By utilizing a Gaussian distribution, much of the noise made by stock prices is ironed away.
Despite the complex mathematics, Fisher Transform tends to give clear overbought and oversold signals since the extremes of the indicator are rarely reached.
How Can Traders Utilize the Fisher Transform Indicator?
One of the benefits of the Fisher Transform Indicator is its role as a leading indicator, not a lagging indicator.
Lagging indicators tend to tell us information we already know. A leading indicator is better at pointing out potential trend reversals before they occur, not as they’re occurring or after the fact.
There are two main ways to trade the Fisher Transform Indicator – a signal reversal or the reaching of a certain threshold.
For a signal reversal, you’re simply looking for the indicator to change course.
If the Fisher Transform indicator had been in a prolonged upswing but suddenly turned down, it could be foreshadowing a trend reversal in the stock price.
On the other hand, the Fisher Transform Indicator could be used as a “breach” indicator for identifying trade opportunities based on certain levels.
A signal line often accompanies the Fisher Transform Indicator, which can be used to spot opportunities in not just stocks, but assets like commodities and forex as well.
Examples
Alphabet (NSDQ: GOOGL)
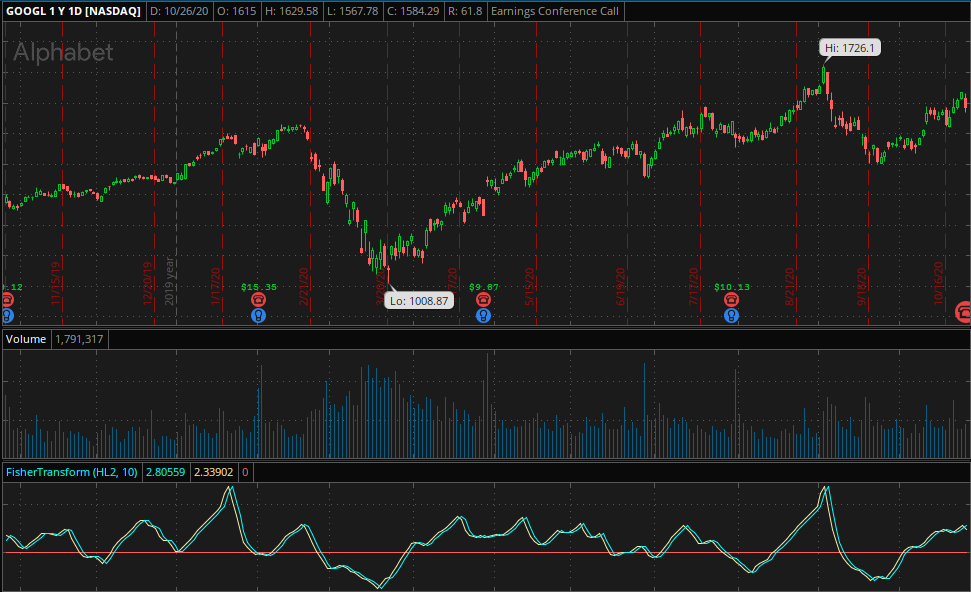
Google has been one of tech’s best stay-at-home plays during the coronavirus pandemic, but you wouldn’t have thought that back in late March when shares cratered down near the $1000 mark.
A bounce eventually came, but the stock didn’t rebound quickly.
However, the Fisher Transform Indicator provided a playbook for the stock beginning in February.
The extreme upper bound was reached around the same time as the market high, offering a sell signal before the end of the month. As the shares fell, the Fisher Transform Indicator moved down to the lower bound and bottomed before the stock.
Buying when the indicator eclipsed the signal line in mid-April would have allowed you to catch most of the rebound.
Nikola Corporation (NSDQ: NKLA)
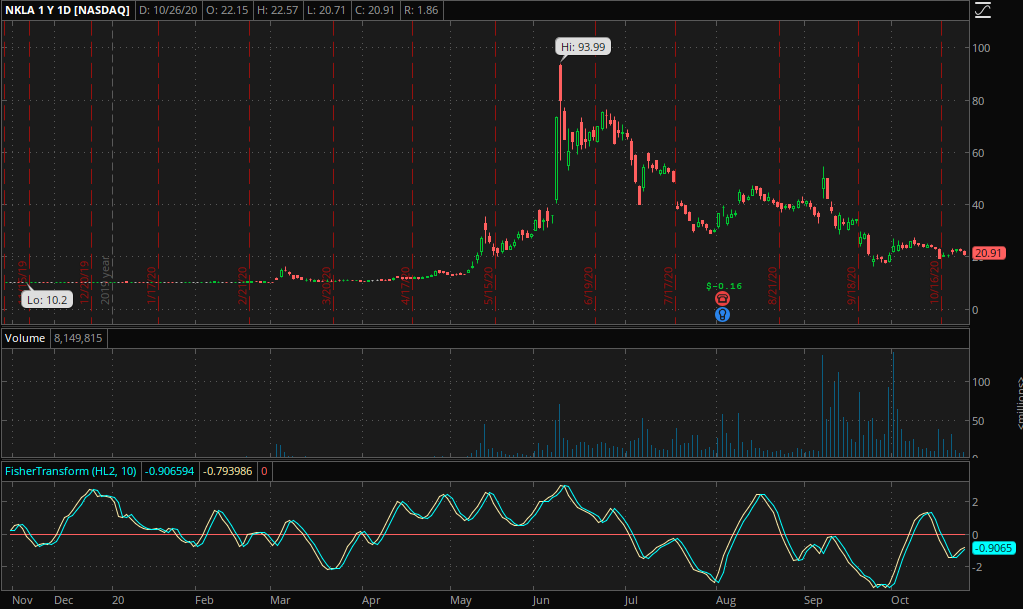
Before becoming marred in controversy, Nikola Corporation was the hottest stock of summer 2020.
The obscure car manufacturer was toiling in the $10-12 range before exploding higher in June.
And I don’t mean just a quick double or triple up – Nikola reached a high of $93 before the music stopped.
When a stock goes parabolic, one of the toughest things to determine is when to take profits and bail.
Nikola was a cautionary tale since the company seemed pretty shady from the start, but traders using the Fisher Transform Indicator got a signal that the top was in before the stock began its quick descent back down.
The June high coincided with the Fisher Transform Indicator reaching its highest level since December of 2019, a signal that sounded the alarm for observant traders.
Bottom Line
You won’t find the Fisher Transform Indicator on your Robinhood or Webull account, but it’s one to have in your toolbox anyway.
Unlike lagging indicators, the Fisher Transform aims to be a leading indicator, delivering a signal with enough time for traders to take action before the trend reverses.
Of course, no trading indicator is a perfect stock price predictor.
The Fisher Transform Indicator still delivers a fair share of false positives and traders shouldn’t rely on it as their only source of price information.
It’s an effective tool that helps bring randomness of asset prices into a more clear focus, but use it in conjunction with your favorite other tools in order to get the best possible results in your trades.


