

Learning technical analysis of stock trends is a great way to develop your day trading skills especially when it comes time to enter or exit a trade.
Although advanced software and nerves of steel are necessary ingredients for successful day and swing trading, one more component is needed: technical analysis. This third variable is how short-term traders predict future price movements.
Introduction to Technical Analysis
Technical analysts look at charts. Specifically, they focus on price and volume movements. They use the information to predict what the price of an asset will be in the future. The basic assumption is that all available information about the financial instrument is embedded in the graph. Thus, no other form of research is needed to make trading decisions.
Technical analysis can be broken down into two categories: technical indicators and chart patterns. Either one of these, or a combination of the two, can be used to identify entry and exit points.
Technical Indicators
Technical studies (or technical indicators) are software programs that are used in conjunction with a graph. Most basic graphing programs today incorporate at least a few technical indicators. They can appear below a graph or lay on top of price action. In either case, they provide buy and sell signals.
It’s important to use the right timeframe for a graph. Looking at 5-year chart of Tesla with daily candlesticks could produce one signal. Meanwhile, a daily chart with 1-minute candlesticks could result in the opposite signal. So it’s important to first consider the length of time you would be in a trade. Then use the appropriate graph.
Chart Patterns
Instead of using distinct software programs to analyze charts, it’s also possible to study charts yourself. This can be done with drawing tools. For example, lines of resistance and support can reveal what the current floor and ceiling are for a security.
Horizontal and diagonal lines can be used to draw a descending triangle. The horizontal line connects low points. And the descending line connects high points that are getting lower with time. That’s exactly what we see on the following chart of Apple with 1-minute candlesticks:

What Is a Stock Trend?
A trend is a general direction that a security or other financial instrument is moving. There are three main trends that day and swing traders focus on: upwards, downwards, and sideways.
A trend can last for any length of time. There is no standard requirement. The longer the trend lasts, the more accepted the trend is.
To identity a trend, you simply need to watch the price action. If you see higher lows and higher highs, you know it’s an uptrend. If you’re seeing lower highs and lower lows, you know that’s a downtrend.
On a graph, traders use lines to more clearly depict trends. For a downtrend, you simply connect one low with a lower low. For an uptrend, a line connects one high with a higher high. We can see both examples in the following minute chart of Apple:

If the price action is bouncing off top and bottom prices, then you have a flat trend. This is also known as sideways movement. The following chart of ExxonMobil uses two horizontal lines to point out the flat price action:
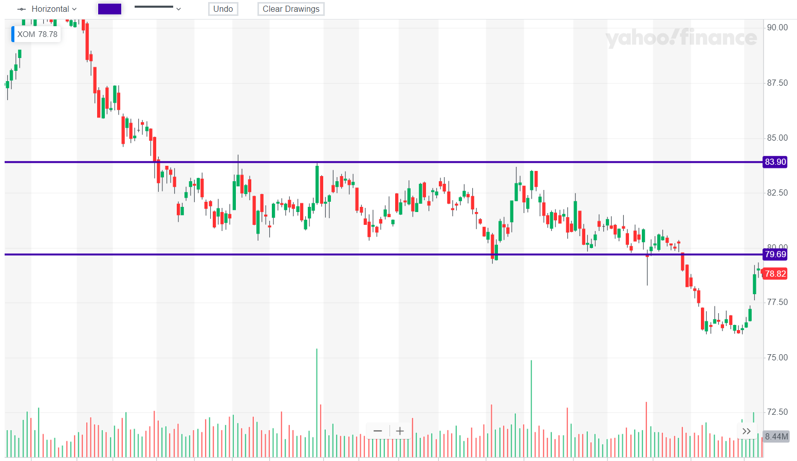
Within a flat range, traders try to sell at a high and buy at a low. Although the price action is flat, money can nevertheless be made.
Notice on the left-hand side, the price action is outside the range. And on the right-hand side, the price action once again is outside the two horizontal lines. Like downtrends and uptrends, sideways trends don’t last forever. You can use technical studies to know when to enter and when to exit.
Examples of Popular Technical Indicators and Drawing Tools
Now let’s take a look some popular indicators and drawing tools that day traders employ.
Relative Strength Index
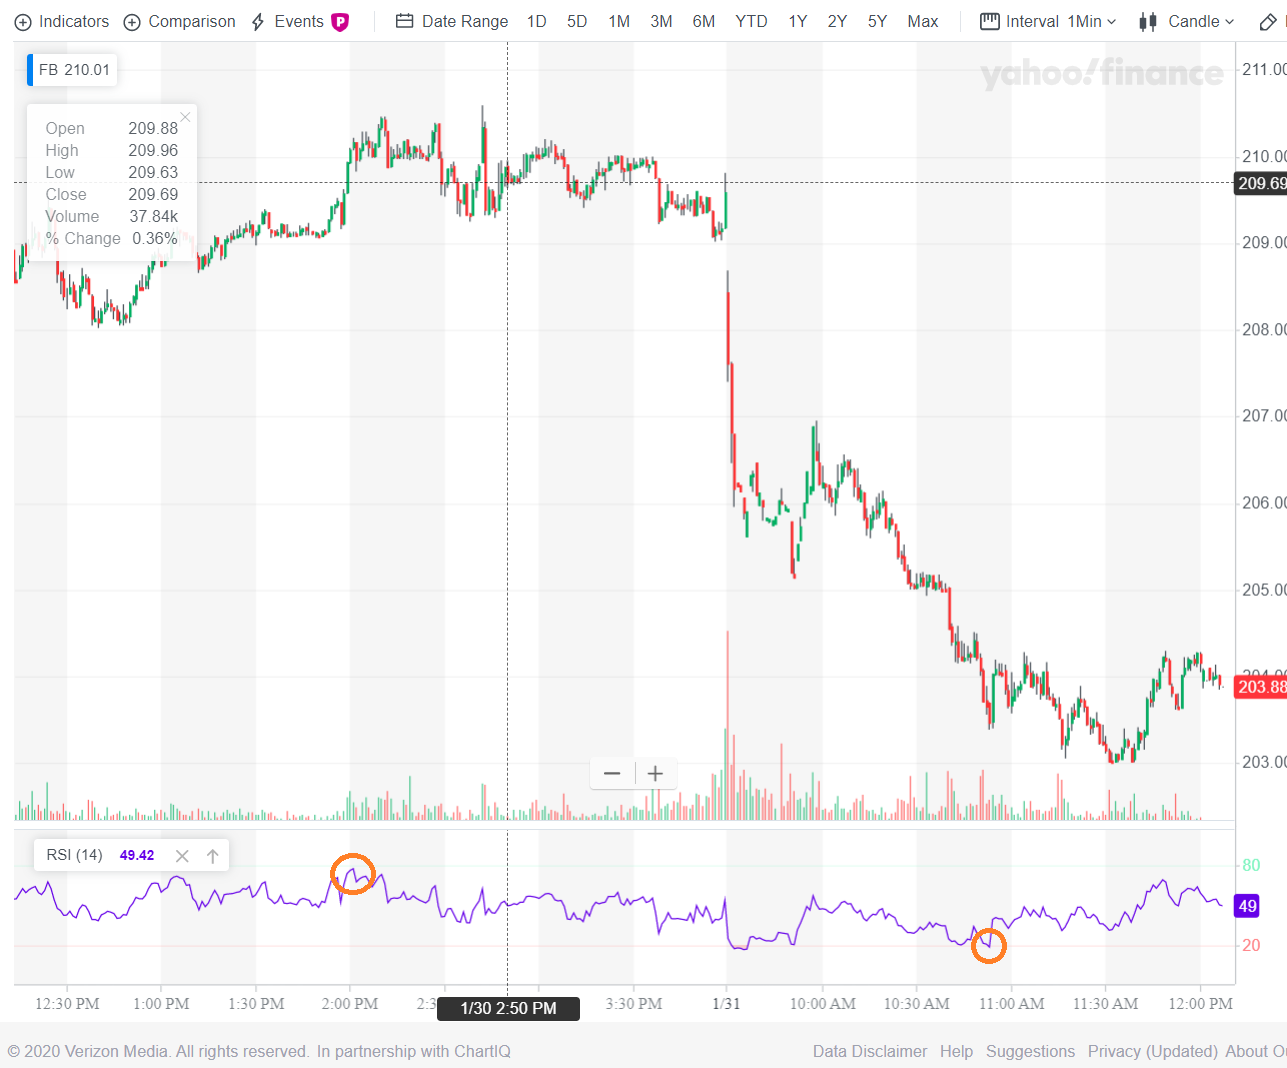
RSI is a momentum oscillator. That means it gauges the change and speed of price movements. The lowest RSI can be is zero, and the highest is 100. Generally, traders consider a figure above 70 or 80 to be a sell signal. An RSI below 30 or 20 means the asset is oversold. We see RSI in the following 1-minute chart of Facebook. Notice that the indicator appears below the chart.
Simple Moving Average
Simple Moving Average is a technical indicator that shows the average price over a defined period. SMA is used to verify trend directions. If SMA is going down, the trend is down. And vice versa.
A sell or buy signal is generated when the price action cross the SMA line. For example, if the price action drops below the SMA, this is a signal to exit a long position. It can also mean sell short.

Technical Analysis vs. Fundamental Analysis
Remember that we said technical analysts use charts. They don’t use financial statements like a company’s balance sheet, income statement, or cash flow statement. Technicians really have no interest in a company’s debt load.
But fundamental analysts do. They pour over a company’s earnings, debt-equity ratio, net cash position, most recent earnings, earnings growth, and many other financial numbers. These figures tell them to buy or sell, not a chart.
Fundamental analysis can be broken down into two basic categories: value and growth. In value investing, fundamentalists take the numbers mentioned above and compare them to an asset’s current price.
This gives them price ratios. A well-known (and often used) example is the P/E ratio, which compares current market price against recent earnings. Typically, they are the TTM (trailing twelve months).
In growth investing, investors are looking at potential upside. They don’t rely on ratios as much because they tend to be very high. A company might actually have no earnings or even negative earnings.
But it could still be a hot stock because analysts have confidence in management, for example. Tesla and Netflix are examples of growth stocks.
How to Learn Technical Analysis
Before starting to day trade, you’ll definitely want to familiarize yourself with using drawing tools and technical indicators. You certainly don’t want to read a study incorrectly and enter a trade at the wrong time, for example. Education and practice are essential prerequisites, especially if you put real money on the line.
Experienced day traders have written books on what it takes to succeed in short-term trading. The book How to Day Trade: A Detailed Guide to Day Trading Strategies, Risk Management, and Trader Psychology is one example. It focuses on risk management and how to set up charts correctly.
Another way to learn day trading is to actually get some practice doing it. That’s where paper trading comes in. On a demo platform, you can place simulated trades without risking a dime of real money. The quality of these services can vary quite a bit. Some don’t have Level II quotes, hot keys, or other advanced features, for example.
Warrior Trading has an online simulator with lots of advanced features, including technical studies. Trades can be placed in real-time, a must-have feature.
A final method to learn the nuts and bolts of technical analysis is in a day-trading school. Thankfully, you don’t have to travel to a brick-and-mortar location to do this. Instead, you can sign up for an online class. Warrior Trading, for example, offers online courses with chat rooms where it’s possible to discuss day-trading techniques.
Tips for Incorporating Technical Analysis Into Day Trading
After you’ve taken your online course, practiced in a demo account, and read your e-books, it’s time to begin. When day trading, remember the following pointers:
- Choose the right assets. If you’re trading the wrong product, it’s going to be difficult to see anything on a chart. Some stocks have such low volume that there simply isn’t much movement on an intraday chart. Keep an eye on a good economic calendar. This will tell you what events are coming up that could trigger major price swings.
- Choose the right broker and the right software. Some trading platforms have less than 10 technical studies in them. Others have a few hundred. Know beforehand what technical indicators and drawing tools you will be using. Then verify that your software has those specific tools.
- Use more than one indicator. It’s certainly possible to receive different signals from different indicators. That’s why it’s a good idea to use more than one technical study at a time. When you use a combination of indicators, you get a larger picture of what the price action is doing.
- Use the right timeframe. Sometimes a 5-minute interval with candlesticks will work. Other times, you may want to use 1-minute OHLC bars. And then there’s the point & figure graph. Remember that day trading is a short-term endeavor. You don’t want to be laying technical studies over a 20-year graph.
Bottom Line
Day trading shouldn’t seem like an impossible goal. Instead, view it as a journey, where you can gradually learn more. As you acquire more skills, you can commit larger sums of capital to your trades.
The sooner you begin, the quicker you’ll find the success you’re looking for.