


What Is A Parabolic Stock?
The term “parabolic move” came about as trader slang. It refers to when a stock makes an upward price move that looks like the right side of a parabolic curve:
A parabolic move occurs when the speed at which the stock’s price goes up increases exponentially. In other words, a parabolic stock is a stock that starts going up really fast.
Here’s what a typical parabolic stock move looks like:

Now lets take a deeper look into shorting parabolic stocks.
Shorting Parabolic Stocks
Today we’re going to look at short selling a certain type of parabolic move: that which takes place within a penny stock. Why? Because most parabolic stocks go back down to their original pre-breakout price.
These stocks are generally penny stocks for a reason. It’s quite expensive to be a public company, and those costs are highly prohibitive the smaller your company is. That’s not to mention the increased red tape public companies have to deal with.
Nowadays, quality businesses can get private equity financing without dealing with the extra hassle of getting listed on an exchange, filing SEC documents, and dealing with shareholders.
So it’s always a red flag when a very small companies opts to remain publicly traded. Often times, but not always, is because they use the capital markets as a cash printing press, enriching management and fleecing shareholders in the process.
Outside of this world of tiny stocks, parabolic moves are relatively uncommon. If you set a filter on your stock screener to look for $1B+ companies that are up 10%+ on the day, your watchlist will be pretty small. Change that market cap filter to look for companies smaller than $100 million, and suddenly you have a sizable list everyday.
This unusual market activity is usually due to news, and the trick is deciphering whether that news is just fluff to pump the stock price, or a fundamental change in the company that will be reflected long-term in the stock price.
When a stock is being pumped, it’s usually only insiders, stock promoters, and traders playing the move, meaning that the pump won’t last. All of these short-term participants will be liquidating their positions soon, making it likely that the price will revert back to its pre-breakout levels.
Further, because these stocks usually have shoddy fundamentals, there are few intelligent long-term shareholders. They’re usually retail ‘bagholders,’ who bought into the stock at a higher price, and are waiting for the next bounce upward to exit the trade even.
When there’s real news that reflects a fundamental change in the company, savvy individual investors and smaller hedge funds are usually taking part in the move, and they’re planning to hold for the long-term, increasing the likelihood that the price will hold above the gap up point. A peek into the company’s filings will usually be enough to decipher this.
Characteristics of Parabolic Stocks
There’s a difference between a small firm who releases a blowout earnings report and a company who pivots from selling iced tea to blockchain projects. We want to focus on the types of companies releasing these hype-ridden press releases, not trying to analyze financial statements.
Exaggerated Press Releases and PR
Management who is more concerned with the promotion of their company’s stock than that of their company’s products/services should serve as a red flag to any prospective investors. For a short seller, red flags are great!
One-way promotional management teams carry out their stock pumping is through the dissemination of press releases with exaggerated claims. They frequently hire outside “investor relations” firms to write and promote this press releases on the company’s behalf.
Such firms are experienced in promoting stocks and know the language that persuades investors to buy shares. They’re also generally paid in tradeable stock (aka, not restricted shares), so the promotional firms have a stake in pushing the price up, often planning to sell their shares into the pump.
A recent example of this was when a company who sell iced tea, Long Island Iced Tea, rebranded to Long Blockchain, citing their intention to shift their focus to opportunities in the blockchain space.
As ridiculous as it sounds, the promotion worked, at least in the short-term. The stock jumped over 200% subsequent to the publishing of the press release. The stock has since been delisted from the NASDAQ and now trades over the counter, with a market cap of less than $5M.

History of Shareholder Dilution
Every company dilutes their shares to some degree. Though, there’s generally a negative correlation between a company’s quality and the amount of shares they issue.
These companies generally choose to raise capital through selling their equity, rather than raising debt because of the steep interest rate they’d pay. For companies that don’t care about long-term shareholder value, raising capital through equity offerings can be like a money printing press.
PIPE: The Easiest Ways for Companies to Raise Capital Quickly
The most common way these companies raise capital is through a Private Investment in Public Equity, or a PIPE. This is when the company sells restricted shares to accredited investors like hedge funds at a discount to the current market price.
This practice has less regulations around it than a secondary offering, and companies can often receive their capital very quickly through this type of offering. In a PIPE, companies are adding new shares to the shares outstanding, diluting the rest of their shareholders.
The buyers of shares in a PIPE transaction received restricted shares, meaning they can’t freely transact on a public exchange until a resale registration statement with the SEC. At that point, the restricted shares will be sold to the public, allowing the buyers to liquidate their positions. You can find these registration statements in S-1 and S-3 forms with the SEC.
When companies announce a PIPE, they do so through an 8-K filing with the SEC, which is a filing that companies are required to file when any material information needs to be disclosed. Some companies are required to file 8-Ks quite often, disclosing a litany of information, so it can be troublesome to sort through them.
Usually, the document is named something like “XYZ Company Announces Private Placement of Common Stock.”
Warrant Overhead Supply
Issuing warrants is another way that companies raise capital, albeit less common than selling unregistered stock. Warrants were among the least common securities sold through a PIPE, with only $565 million raised through issuing warrants in the eight-month period between January and August 2018, according to PrivateRaise.com data. This is compared to the more than $22 billion raised through selling common stock.
A warrant is basically an option contract issued by the company. Unlike an options contract, which you can choose to write or buy, you can only buy a warrant. They’re usually traded over-the-counter and they’re seldom offered by popular US stockbrokers. One exception is Interactive Brokers.
However, we’re not talking about trading or investing in warrants. We’re talking about looking in filings to see at what prices the holders of these warrants are likely to exercise them.
While they’re relatively uncommon in US markets, that makes paying attention to the companies that have issued warrants all the more important.
Traders seldom consider a stock’s capital structure during their pre-trade analysis process. I think this step is especially crucial when deciding if we should trade these crummy penny stocks that have just made huge parabolic moves.
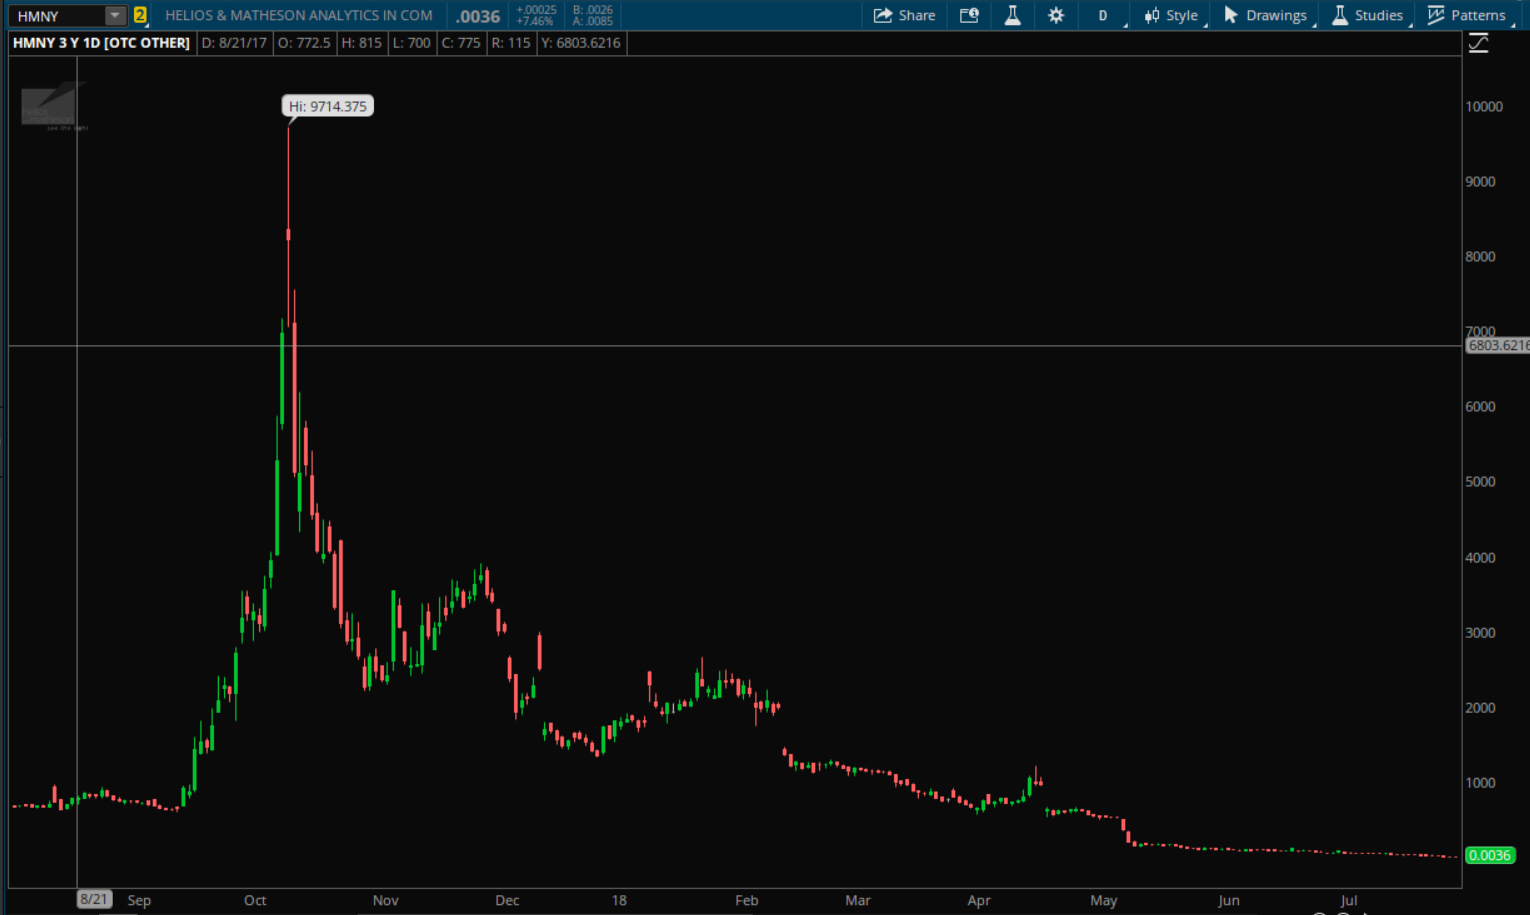
It’s hard to know when a parabolic move will begin to lose it’s momentum.
In the case of HMNY in 2017, it rallied much longer then any short seller thought possible. Generally these moves last a handful of days before cratering back to pre-breakout levels, but HMNY’s rally lasted for about a month before pulling back.
One way to put the odds further in your favor is to look at which prices the company issued lots of warrants at. You can find this data in annual and quarterly reports (10-Q and 10-K filings).
Analyzing The Financials
It’d be understandable if a short-term trader never does fundamental research on the companies he trades. It’d even be reasonable if he didn’t know how to perform basic fundamental analysis on a company. After all, price action is what pays, and typically the fundamentals are already discounted into the stock price.
Shorting parabolic stocks is one of those times where having an understanding of the company’s financial position and digging into filings is not only beneficial, but is probably necessary to avoid getting blindsided.
However, one can’t expect to become an expert on corporate finance in a short period of time on top of your trading and trading-specific education.
So here’s a few key things to pay attention. This list isn’t exhaustive, and the better your understanding of corporate finance, the better off you’ll be trading within these stocks.
Cash Burn
Cash is the lifeblood of a company and penny stocks are infamous cash burners. They typically don’t have profitable operations to provide them positive cash flow, so they’re forced to continuously go to the capital markets to refresh their cash position.
It’s vital to understand how quickly a company burns through their cash, if they do at all. To get a look at this, we’ll direct our focus to the company’s cash flow statement.
This is found within the company’s most recent quarterly report which will either be a 10-Q or 10-K, filed with the SEC. The cash flow statement can be found under the “Consolidated Financial Statements” section in the document.
There are three categories of cash flow that companies report: cash flow from operations, cash flow from investing, and cash flow from financing. To calculate cash burn, we want to focus on cash flow from operations.
This tells us how much cash is coming in and out of the company due to their daily operations and we want to use it to get an idea of the company’s monthly cash burn, and how many months of cash they have left until they have to raise capital.
Here’s an example:

Above is the operations segment of a cash flow statement. We can see that the net cash used in operating activities is -$3.3M over the six month period ending on June 30th. We simply divide $3.3M by 6 to get the monthly cash burn of the company, which comes out to $553K per month.
Now we use this monthly cash burn number against the company’s cash balance to get a perspective on what their current cash position looks like. The company’s current cash balance can be found on the balance sheet, as seen below:

We can see that the company’s cash balance at the end of June was $17M. At the time of writing, it’s October 18th, so we’ll multiply the monthly cash burn by 3.5 for the time that has passed since the filing.
This adjustment brings us to an estimated $15M cash balance at the moment, or roughly 27 months of cash. With over two years of cash, this company doesn’t have to raise capital immediately.
Current Ratio
Another quick way to get a barometer on the company’s ability to continue operations in the short-term is through a simple financial ratio known as the current ratio. This basically compares the company’s total liabilities, or short-term debts due within a year, and the company’s current assets, or assets that can be turned into cash within a year.
This gives you an idea of the company’s ability to pay back their short-term debt with their current assets.
You simply find current liabilities on the company’s balance sheet, and divide it by the company’s current assets.
Readings below 1 indicate the company would be unable to pay back their debts with their current assets. The higher the ratio, the better the company’s short-term financial liquidity.
How To Find Parabolic Stocks
Parabolic penny stocks are generally quite easy to find with a stock screener because how few filters you need.
With that said, some liquidity filters are generally best practice.
- Stock Price > $0.50
- Average dollar volume > $1 million
- Percentage change > 10%
- Exchanges: NYSE, NASDAQ
- Generally best to exclude OTC
Risks of Shorting Parabolic Stocks
Shorting parabolic stocks is a high-risk, high-reward endeavor. It makes intuitive sense to most traders. If you can identify a garbage company that has just multiplied it’s value based on some sort of manipulative tactic, we know that market efficiency will kick in at some point.
Despite this, markets are chaotic and unpredictable. We’ve all heard that the market can remain irrational longer than you can stay solvent, and this is particularly true with respect to parabolic penny stocks.
A perfect example of parabolic penny stock’s chaotic behavior on display is in the case of the company Enteromedics (ticker symbol was ETRM at the time) between December 2016 and January 2017. On December 28th, 2016, the stock broke out of a years-long range to new highs. Then it broke out again, and again.

On December 27th, 2016, the stock was trading at $0.04. On January 10th, 2017, the stock was trading above $30. That’s a percentage increase of over 75,000%. I’m sure several short sellers of this stock not only had their accounts blown out, but owed money to their brokers.
Halt Risk
I’ve read some horror stories from short sellers who got stuck short a halted stock. You not only run the risk your capital being tied up in a halted stock, but you risk the stock being delisted from it’s exchange, leaving no market to close out your position.
The stocks most popular among retail short sellers are often the stocks that get halted. One recent example is Longfin Blockchain in April 2018.
Low Float and Low Liquidity
It’s typical for these stocks to have a low float, leaving a very small supply of shares to trade. Parabolic low float stocks are famous for their runaway short squeezes. Not only is their demand and momentum from traders on the long side, but short sellers are forced to buy back in as the price increases.
Additionally, the spreads are usually quite wide on these stocks, making it costly to trade in and out of. A common maxim among veteran traders is “you seldom have a problem establishing a position, the problem arises when you want to get out of that position.”
The combination of these two factors can lead to significant slippage when you close your position. This makes backtesting these strategies difficult, as modeling fills in these stocks is basically a guessing game.
Overnight Risk
Holding a short position in these stocks overnight is tricky. The biggest returns are generally made when holding overnight, but you also risk the stock gapping up against you. Just ask this short seller of KBIO who not only had his $37,000 trading account wiped out, but ended up owing his broker $106,000 after holding a short position in KBIO overnight and waking up to the stock having multiplied.
There was no real way to hedge against this risk, as the catalyst that catapulted the stock was “Pharma Bro” Martin Shkreli announcing his intention to buy the company, an event nobody can really plan for.
The only thing one can do is keep their overnight position sizes very small, and to set strict risk-control parameters.
Trade Entry: Momentum Divergence
Put as simply as possible, momentum is the level of aggressiveness in a market. In parabolic penny stocks, buyers are very aggressive during the early part of the move. As the interested buyers have acquired their shares, the trend begins to slow.
Buyers are getting less aggressive in pushing the price up and less volume is being done.
At this point, the stock price is still probably increasing though. This is where the ‘dumb money’ (retail traders with less capital to move prices up) is establishing their positions, they’re the last buyers. The directions of the price and momentum have diverged, and momentum precedes price.
Momentum oscillators can help us spot divergences.
One that is especially helpful is the two-day rate of change on the daily chart. When price is making highs without making momentum highs on the 2-day ROC, that’s a sign that the rally is weakening. Coupled with intraday confirmation, this can be an effective way to enter these trades.
Final Thoughts – Shorting Parabolic Stocks
I once heard a trader remark that “it’s easier to find a shoddy company than a great company,” and that couldn’t be truer when it comes to microcap penny stocks.
Especially in today’s economy, with a flourishing private equity market ready to contribute capital to quality private companies, there is little reason to deal with the added red tape of being a publicly traded company at such low valuations. This ends with the majority of microcap penny stocks being very low-quality companies that don’t care about long-term shareholder value.
When one of these companies multiplies their share price overnight, the risk-to-reward ratio on a short trade can be so in your favor as almost all of these companies come back to their pre-breakout prices.
Success in this type of trading is usually curtailed by very manageable factors, risk management and position sizing being chief among them.