


What makes a trade great? Is it the rate of return, superior timing, ability to think differently? In my opinion, a great trade is when a trader identifies an opportunity with an asymmetric reward/risk ratio, follows their personal trading principles to a tee, and is able to size up on the trade to hit that home run.
In this article, we’ll look at what I think are three of the greatest trades of all time, the processes behind them, and what we can learn from them.
Andy Hall’s – Greatest Trades of All Time

Andy Hall is remarked as one of the best oil traders of all time. His trading firm, Phibro, formerly a Citigroup subsidiary, consistently achieved massive earnings even while Citi was hemorrhaging money.
In what has to be one of the most creative trades ever documented, Hall was able to take advantage of the difference in oil futures prices and the oil spot price.
Noticing the delta between the price of physical oil and the market price of near-dated futures contracts, Hall and his firm devised a plan to cash in on this arbitrage opportunity. In 2009, when the spot:futures delta widened considerably, Phibro bought a million gallons of oil and rented supertankers to store the oil offshore until the spread between the two markets closed.

Because the US was in the midst of a recession in 2009, Hall and Phibro were able to capitalize on falling shipping prices due to the industry’s slump. This made their rental and storage of the supertankers cheap, so as long as the delta between spot and futures prices closed before the leases got too expensive, Phibro made money.
Hall was so valuable Citigroup that he was paid a $100 million bonus in 2008 by a company in dire financial straits.
Lessons from Hall:
- Being highly capitalized opens countless opportunities to exploit inefficiencies.
- Not all trades are done on a computer. Buying bulk inventory at liquidation prices and selling it for close to full price can also be considered a good trade.
- Specializing in one asset has huge benefits. Rather then dividing his time among stocks, interest rates and commodities, Hall focused all of his time on one commodity–oil.
- Consider that the person taking the other side of your trade might be the Andy Hall of that asset.
Paul Tudor Jones’ Black Monday Short
“If it walks like a duck and quacks like a duck, it’s probably not a chicken.”
Paul Tudor Jones tripled his money trading the Black Monday crash by being a contrarian and forming a thesis that held ground on several fronts, giving him enough conviction not to be shaken out by market noise. This definitely goes down as one of the greatest trades of all time.
Paul Tudor Jones likely trades differently today than he did in the 1980s, now managing around $40 billion in assets, but his process for forming his bearish thesis on the 1987 stock market can teach us a lot on how to form a market outlook.
Technical analysis and more specifically, Elliott Wave theory, was the basis for Jones’ market timing and position management, but his views on the market structure and fundamentals were also bearish and get less attention in coverage of the trade.
Fundamental View
“In 1987, you can just look at any historical metric and see the stock market is stupidly overvalued.”
- Paul Tudor Jones being interviewed by Lloyd Bankfien
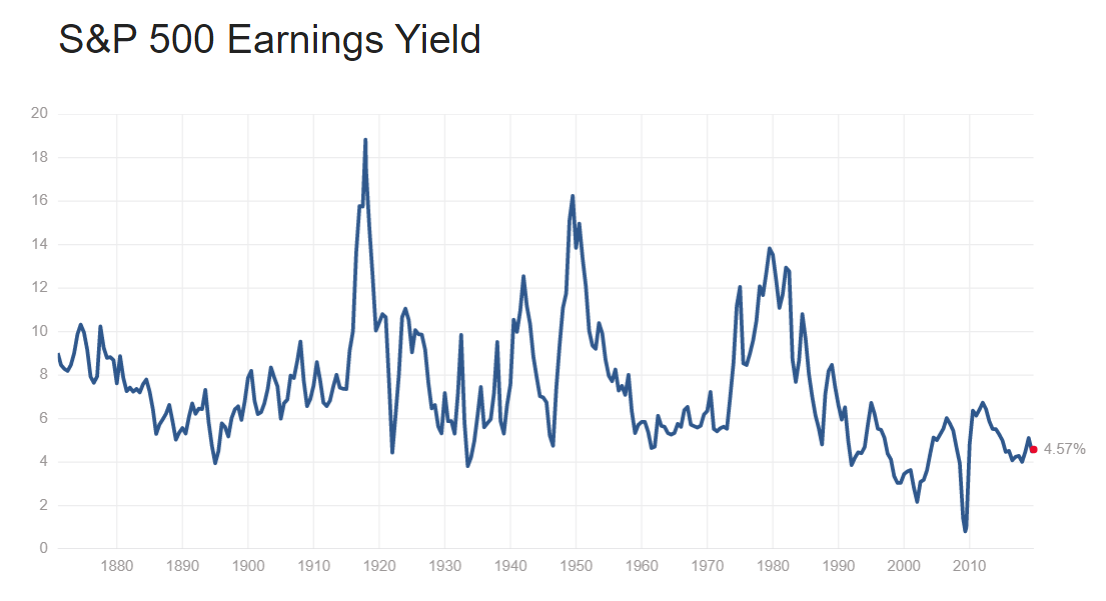
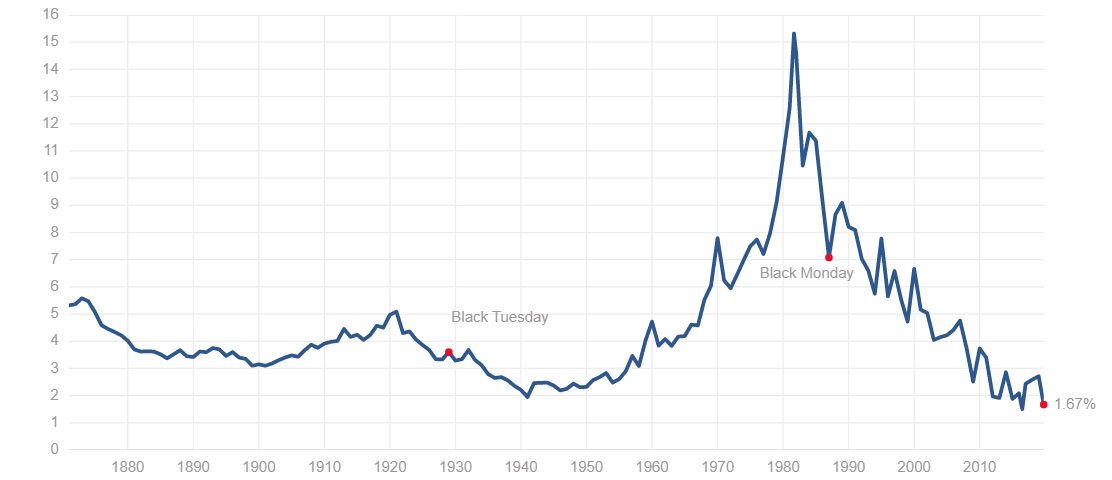
In 1987, prior to the crash, the S&P 500’s earnings yield was around 5%, near its historical low. Put another way, the market was trading at around a 20 price:earnings ratio, right around where the market is today. The difference is, that in 1987, the 10-year treasury yield, the risk-free rate, was hovering around 10.5%. Contrasted to today, the 10-year treasury yield is 2.66%, making stocks more attractive, hence the higher valuations.
Tudor saw stock market valuations as unsustainably high given the historically low earnings yield paired with high treasury yields.
S&P 500 earnings yield:
10-year Treasury Yield:
Market Structure
The practice of using “portfolio insurance,” also known as options or futures, became commonplace during the 1980s. Wall Street began to sell investors on these derivative contracts as a way to effectively eliminate any major drawdowns from your portfolio for a cost.
However, buying puts to reduce drawdowns is not really like buying an insurance policy. Insurance companies underwrite measurable risk. They know the average amount of car accidents that happen in a given area, and how much it costs given the car you drive. Pricing their premiums with these statistics in mind allows them to profit over a large number of occurrences. They also know that there isn’t a situation where all of their customers will get into car wrecks at the same time, leaving them insolvent. They’re underwriting specific risk, not systemic risk.
When it comes to index futures, they’re simply a leveraged position in a stock index. There is no benefit other than the reduced margin required, and the fact that there’s a high level of liquidity (at least during stable conditions). It was just another way for Wall Street to sell the next financial product.
Jones knew the potential catastrophic effects that the widespread use of derivatives could have on the market, when investors try to sell their stocks and leveraged futures positions at once, all while option writers are getting margin calls enmasse. He attributes most of the major market downturns in the last three decades to derivatives. A recent example is the short-vol explosion, fueled by the massive leverage in short volatility strategies.
He also knew that huge downturns fuel market irrationality, and that index futures had no limit-down or limit-up circuit breaker in place to reduce market volatility, like the commodity futures he used to trade had.
Technical View
Jones’ technical analysis is what brought everything together. It’s what prevented him from entering his position prematurely and having to endure being short for a year of bull market activity.
His technical view was based on Elliott Wave theory, with the basic idea behind the theory being that markets move based on human behavior, and that human behavior can be tracked through repeatable price patterns.
Jones and his statistician Peter Borish’s technical analysis process was detailed in the 1987 documentary Trader.
Jones and Borish saw huge resemblances between the market movements leading to the Great Stock Market Crash of 1929 and market activity pre-Black Monday. The Elliott Wave ideology grants this significance, because it essentially says humans react similarly during boom and bust cycles, and that market charting is simply behavior charting.
‘50 Cent’ Volatility Trader
The Short Volatility Crash of 2018 is coming up on its second anniversary, and it’s when a mysterious trader, only known as ‘50 Cent’ cashed in big time, scooping $200 million off the trade.
To understand why ‘50 Cent’ (not the rapper!) made this trade, we have to understand the market environment prior to the blowup of short volatility strategies.
Volatility has become an asset class on it’s own. As Wall Street ‘innovated’ with financial engineering, several products have been released to trade expansions and contractions in volatility, without using an actual underlying asset. First came VIX futures, and somewhere down the line came exchange-traded notes (ETNs) that track the VIX. The ETNs which short the VIX became massively popular due to the low volatility that the broad market had been experiencing for the better part of a decade.
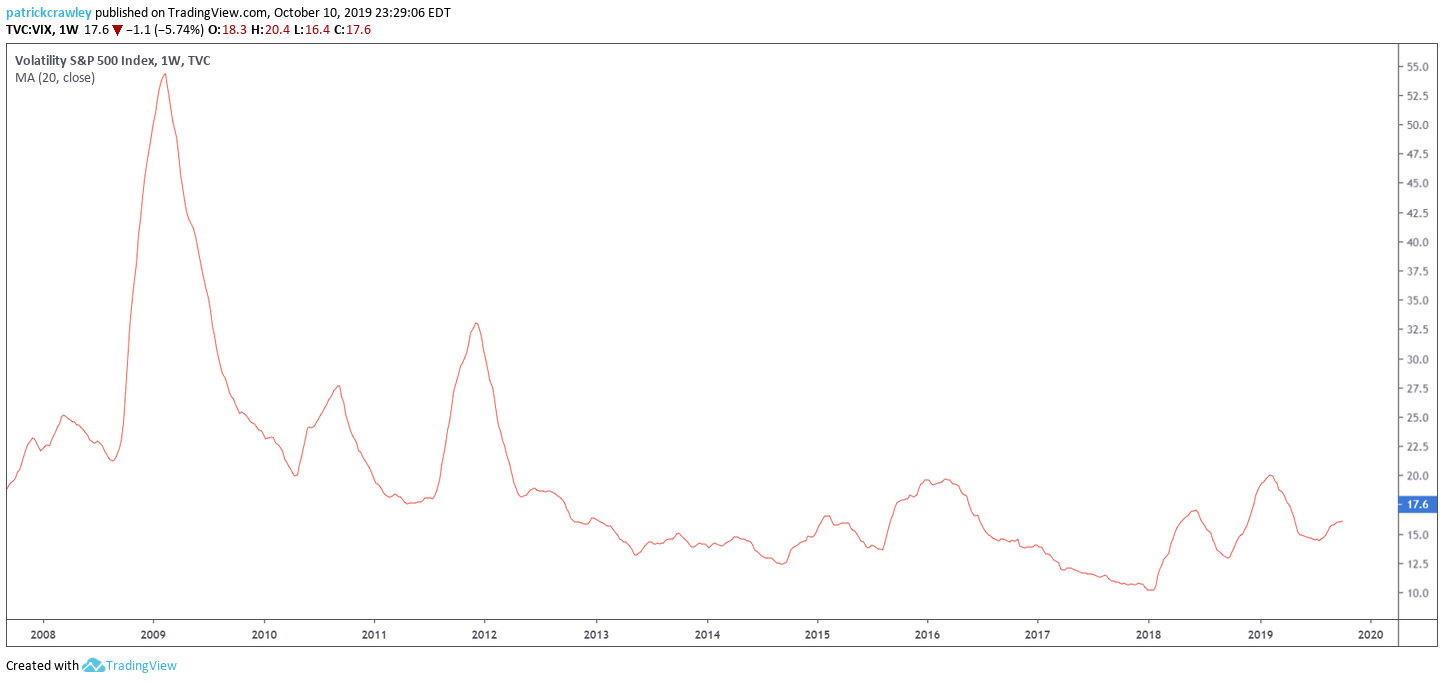 20-week moving average of the VIX after the financial crisis
As you can see, the VIX looks more like an ECG than a market chart. Because of this, traders would wait for a spike in volatility, then get short, expecting a reversion to the mean. And it worked for years. Until it didn’t and a lot of people went broke.
The middle phase of a bull market is usually characterized by low volatility: a slow chugging upwards in price, with few opportunities for pullbacks presenting themselves.
Somewhere around January 2017, 50 Cent began buying out-of-the-money VIX calls priced at $0.50. This continued for over a year. At one point, his projected loss on the trade was $200 million in expired options premium.
Here’s a chart that attempts to guess his P&L since 2017:

Not much is known about 50 Cent’s trade thesis, all we can do is guess. Volatility-focused fund Artemis Capital Management wrote a whitepaper explaining that they saw the short volatility as an ouroboros, or a snake eating its own tail. It’s quite possible that 50 Cent could have held some of these views. Here are some choice quotes from the paper:
 From Artemis Capital Management’s 2017 whitepaper “Volatility and the Alchemy of Risk”
“The Global Short Volatility trade now represents an estimated $2+ trillion in financial engineering strategies that simultaneously exert influence over, and are influenced by, stock market volatility.”
“Volatility isn’t broken, the market is…”
“The problem is volatility isn’t just keeping score, but is massively affecting the outcome of the game itself in real time. Volatility is now a player on the field.
It’s also possible the trade was a hedge against a large long portfolio, which Macro Risk Advisors, the firm who tracked 50 Cent’s trading, speculated as a possibility. Whatever the case may be, it still goes down as one of the greatest trades of all time.
Regardless of what 50 Cent was thinking, there are some lessons we can learn from his trade:
- Sometimes the most successful trades fly in the face of conventional wisdom. If 50 Cent was following a trading book, he would have cut his losses well before he got paid off.
- Look for crowded trades around you. Does it seem like all of the traders around you are making similar trades? Could that be a catalyst for a micro-crash of its own?
- Contrarians get the big paydays. Herd-following traders and investors don’t hit home runs.
Final Thoughts – Greatest Trades of All Time
These are three examples of some of the greatest trades of all time. Andy Hall was able to identify a low risk arbitrage opportunity and used his infrastructure to leverage up and hit a grand slam on it. Paul Tudor Jones formed a multifaceted bearish thesis, and used technical analysis to time the market masterfully.
50 Cent’s trade was more Soros-esque, he identified a feedback loop in the market that created an extremely crowded trade in short volatility. While he wasn’t able to time the market with the same precision as Tudor Jones, he capitalized on the snapping back of the rubber band.