

-
Value for Investors
-
Value for Traders
-
Customer Support
-
Cost and Fees
-
Reliability
Summary
ChartSmart is a premier stock screener. Allowing for easy screening and including technical analysis tools, ChartSmart is a nice and easy way to find the right stocks to trade or invest.
As a technical research tool and investment software, ChartSmart was founded over 25 years ago. Currently headquartered in Vancouver, Canada, ChartSmart started by offering an end-of-day stock charting and screening software.
As a standalone program, the stock charting and screening software is one of the earliest investment tools that aided traders and investors to spot trends and analyze market performance.
Bob Stranks, the current President and CEO of ChartSmart developed the stock screening and technical analysis software thus pioneering a new method for investors and traders to find investment opportunities. In addition, the program assists traders in making smart trading decisions.
Today, ChartSmart is more than an end-of-day stock charting software. It has the following additional features – stock screening, technical analysis and stock filtering – that enable traders to scan, sort and classify thousands of financial instruments in minutes.
In our ChartSmart review, we will delve into the features, services and pricing information offered by ChartSmart.
ChartSmart Features and Services:
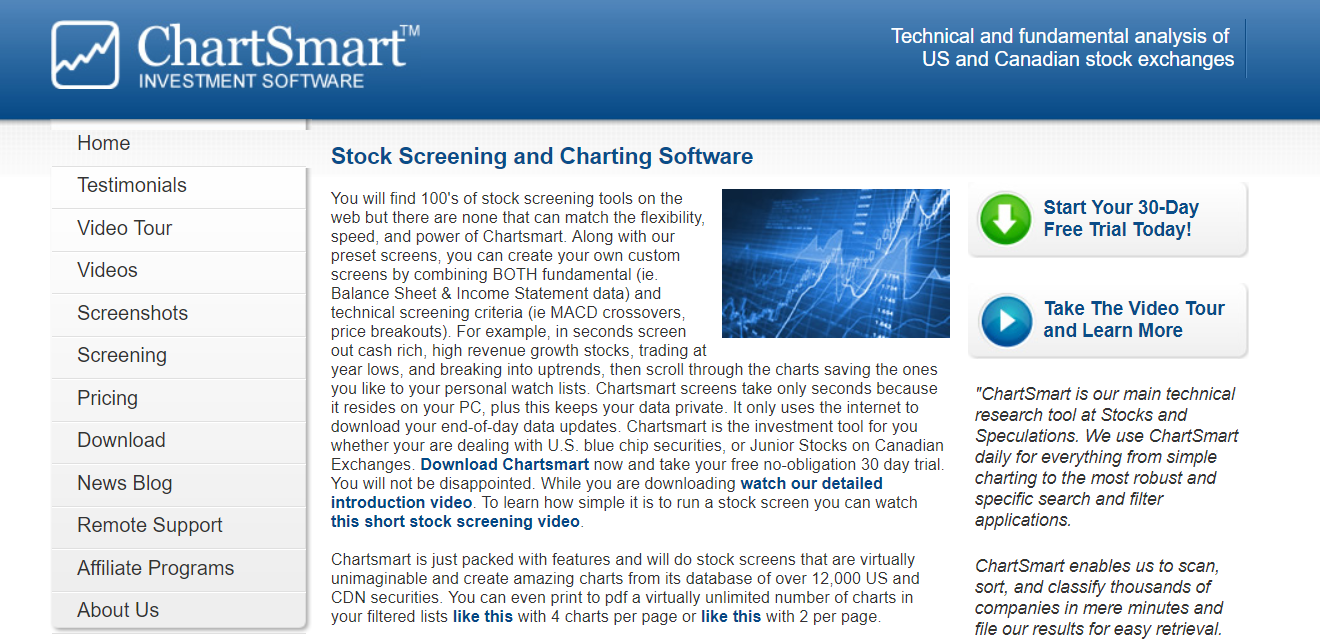
ChartSmart Stock Charting and Screening Software
With over 100 stock screening tools available on the web, none has been able to match the power and speed of ChartSmart charting software. As a powerful technical analysis and stock filtering application, traders can scan markets in search of the best investment opportunities.
With hundreds of options to select from, users have a chance of scanning markets based on technical and fundamental screening criteria.
As a stock screening tool, the only time the software connects to the internet is when downloading end-of-day data updates. The data and screens are stored on your PC which keeps your data private.
As an investment tool, it is the best option for traders dealing with US blue-chip securities or Junior Stocks available on Canadian Exchanges.
The stock charting and filtering software is packed with several features and below is a quick look at a few of them.
Compatible with Windows OS
As said earlier, ChartSmart stock screening software can be installed in your PC and run as a standalone program. It is designed to run on all Windows OS versions in exception of Windows XP and Windows Vista. The reason why it’s not advisable to run the software in the versions above is that Microsoft no longer provides updates. As a result, your system will be susceptible to vulnerabilities.
Criteria tabs:
- Exchange tab – lists both major US and Canadian exchanges
- Sector Tab – the screen combines more than 150 sectors
- Type tab – displays security types such as warrants and master sector groups
- Price tab – this is a price related screen that displays price changes from a year high/low in percentage
- Volume tab – this is a volume related tab and displays the trade volume and volume breakouts
- Tech tab – displays technical screening variables such as RSI and MACD
- Fund tab – displays fundamental screening variables such as ratios, dividends, and revenue
- Watch tab – allows you to run your stock watch lists
- Port lab – allows you to run your different portfolios
- Lastlist tab – enables you to run additional subscreens from your last screen run
- Ind tab – displays a screen with Canadian index group
- Custom tab – displays a screen with US index groups
- Special Tab – displays a screen with a new listing, stocks with split and news keywords.
- You specify tab – this is where users can create custom screens
Fundamental and technical indicator screens
ChartSmart is one of the best end-of-day stock charting and screening software that covers both US and Canadian equities. As such, the following screens are available to traders:
- Technical indicator screen – provides access to indicators such as Moving Average, ADX, RSI, Stochastic, Bollinger Bands, MACD, Williams and more.
- Fundamental variables screen – provides access to variables such as financial ratios, EPS growth and revenue.
Users have the option of screening – any of the 150 industry groups, candlestick chart patterns and stocks with new listings among others. They can also customize screens using their own screening formulas.
All one has to do is select from the list of over 100 variables. Afterward, users can run the screens and scroll through the detailed candlestick charts or OHLC.
Plot Fundamentals
With ChartSmart, users can plot fundamentals such as cash, inventory, and revenue on the charts. As a unique feature exclusively available on ChartSmart, users can also view changes in price on the chart. This is relative to revenue growth.
Create a filtered list of symbols
Once a user has created a filtered list of symbols, he or she can reformat them to match another software he or she is using. As a result, traders have the option of importing these symbols into another software.
For instance, users can run a screen for stocks with positive earnings and dividends. They can reformat the symbols and import the list into another stock charting and technical analysis software. In addition, they can export end-of-day daily and historical data using popular formats.
Create unlimited portfolios and watch lists
As a flexible stock screening software, not only are you allowed to organize and manage different screens but traders can create unlimited portfolios and watch lists using ChartSmart.
Afterward, they can take various lists of stocks and create further screens. To create unlimited watch lists, click on the filter menu then click the criteria to be used. Once you have done this, you should view the selected filter set on the left and tabs on the rights.
The tabs include:
- Watch tab – allows you to run screens on stocks that include your different watch lists
- Port tab – allows you to run stocks that include all your different portfolios
- Ind tab – displays a screen that includes Canadian index groups. The list is updated periodically
- Custom tab – displays a screen of US index groups. This list is also updated periodically
- Lastlist tab – allows you to run more subscreens
Trendline crossover screens
This is an exclusive feature that draws trendlines on arithmetic charts and also screens out stocks that cross the trendlines. To use this feature on ChartSmart, navigate to the charting menu; click “Tools” followed by “Annotations” and “Trendlines.”
News Headline and Releases
Under the News Filtering Menu, there are two tabs namely News Headline and News Releases. Under News Headline, you can select any of the available phrases and the date range. Once you have set the right parameters, the screen will display News Headlines relevant to the selected date range. This feature is quite useful as it can help you find stocks that have been funded recently.
ChartSmart Remote Support
ChartSmart offers remote support to its users by accessing their computer remotely regardless of where the user is located around the world. To get help, users must first send an email to the support team to inform them about a certain problem.
Once the team receives the email, they will set up a remote session by sending an email containing a unique link.
Users are required to click on the link to initiate a remote session. They should follow the steps and instructions as provided under the email link. It is important to ensure that your computer is connected to the internet during the whole process.
Once you have received help from ChartSmart support team, the remote session will be ended permanently. During the whole session, the team will not be able to access your folders and files.
ChartSmart Pricing
Users have a chance of trying out ChartSmart stock screening and charting software for free. The 30 day Free Trial allows users to download the software, install it in their PC and try out some of its features.
After the 30 day Trial period has elapsed, users have the option of subscribing for a paid version.
ChartSmart subscription is priced at $600 Canadian dollars and the subscription plan is billed annually. If you subscribe a month other than December, ChartSmart will bill you the balance of the calendar year but if you are renewing your subscription, you will be billed for the whole year.
Currently, ChartSmart does not offer a monthly payment option.
Canadian residents are taxed according to where they reside when they subscribe to ChartSmart as follows:
- British Columbia, Alberta, Manitoba, Quebec, Yukon, NW Territories and Nunavut – add 5%
- Prince Edward Island, New Brunswick, New Foundland and Nova Scotia – add 15%
- Ontario – add 13%
If a user wishes to cancel his or her subscription before the calendar year ends, ChartSmart will refund the balance.
Final Thoughts
ChartSmart is a unique stock screening, stock charting, stock filtering and technical analysis software currently being used by professional traders around the world.
The software is packed with features such as the option to create custom screens, the option to create stock watch lists and unlimited portfolios.
Compatible with all Windows versions, ChartSmart must be downloaded and installed in the user’s PC for it to work. From there, users can run it as a standalone program.
Although ChartSmart is a powerful stock screening and technical analysis tool, currently, there is no monthly subscription. Users only have one option – annual subscription.
Another drawback that we found out is that ChartSmart is available as a download-only product. Currently, ChartSmart does not offer a web or mobile version of the software.
Overall, ChartSmart is a great product thanks to the numerous features it comes with and the 30 day Free Trial that allows traders to try out the software features for free.