

2016 – Year In Review: Trading Statistics +$222,244.91
January – May Statistics: +$47,464.22 in Gains
Hey everyone! Today we’re going to look at my 2016 day trading statistics. Although I finished 2016 with just over $222,244.91, I started off the year very slowly! Let this give you hope that even if in 5 months you only make $47k, $222k is still possible! I’m happy to say that although I had a few red weeks, I didn’t have 1 red month in 2016. The only thing I can say about 2016 is what a year! This was the first year I decided to focus exclusively on 1 trading strategy and it really paid off. In 2016 I made 2 resolutions that started on January 1st.
- Only Trade Size on Momentum Stocks
- Only Trade 9:30am-12pm
Through January I traded on a hot streak with fantastic accuracy. I didn’t have a single red day in January, but in an attempt to break my record for the longest hot streak, I was being very conservative and didn’t make much money. February was extremely slow, and in March I was trading in my Suretrader account doing a small account challenge (I haven’t included the results of my 2016 Suretrader Challenge in this P/L). I also took a trip to California, although I traded from 6am-9am each morning while I was on vacation.
As the year went on I added more rules to my trading plan. After a fairly slow start to the year, I made a commitment at the end May that in June, I would now add two new rules to help me reduce the number of trades I was taking, but increase my profits.
3. Only Trade A Quality Setups
4. Take 2x Size on A Quality Setups
As a result of adding rules #3 and #4, I finished June with just under $35,000.00 in profits, making it my best month of the year.
Summer 2016 Trading Statistics: +$94,119.54 in Gains
I powered through June, July, and August, and made a total of over $94k. In July I only had 2 red days and 14 consecutive green days. During July I traded for a week from Paris, logging in at 3pm and trading until 6pm. This was a totally different schedule for me, but I enjoyed the change in routine! I trade less aggressively because my internet connection was a big weak and I didn’t want to have a big loss while traveling.
September – December Trading Statistics: +$78,065.05
I expected the fall is when my trading would go to the next level, but it actually slowed down. Over the course of 4 months I generated a little less than $20k/mo average. I finished those four months with just over $78k. Frustratingly, my accuracy was only 63%. I was feeling the frustration, especially as I had 3 consecutive red days going into the Christmas holiday. Despite having 7 red days in December, I still managed to finish the month with just over $21k thanks to a few big winners.
Goals for 2017
As 2016 came to an end I began to set my sights on 2017. In December I decided to fund a $583.15 account with Suretrader to test my skills at growing a small account. Initially I wasn’t sure I would make it public that I was trading with such a small account, but then I decided what the heck. It adds pressure, but I’m going to do this in front of our students, for better or for worse. I want all of our students to see the real ups and downs of growing a small account. January 3rd was Day 1 of the Small Account Challenge. In the first 8 days, I grew the account 526% to a total balance of $3,600.
I’m setting benchmarks for my small account. The first goal is $25k and I’m hoping to get there by March. The next benchmark is $100k. I believe it’s possible to take a $583 account and turn it into $100k trading momentum for 2 hours a day. In 2017 I will attempt make this belief reality. It will be a challenge, but I’m excited!
Through 2017 I’d also like to take steps to improve my metrics. That means improving my accuracy from 66% to 70%, and increasing my profit loss ratio from 1.27 to 1.50. I think by continuing to focus on A quality setups I should be able to see steady improvements.
Lastly, 2017 will continue to be a year where I dedicate myself to my students!
2016 Trading Statistics & Reports

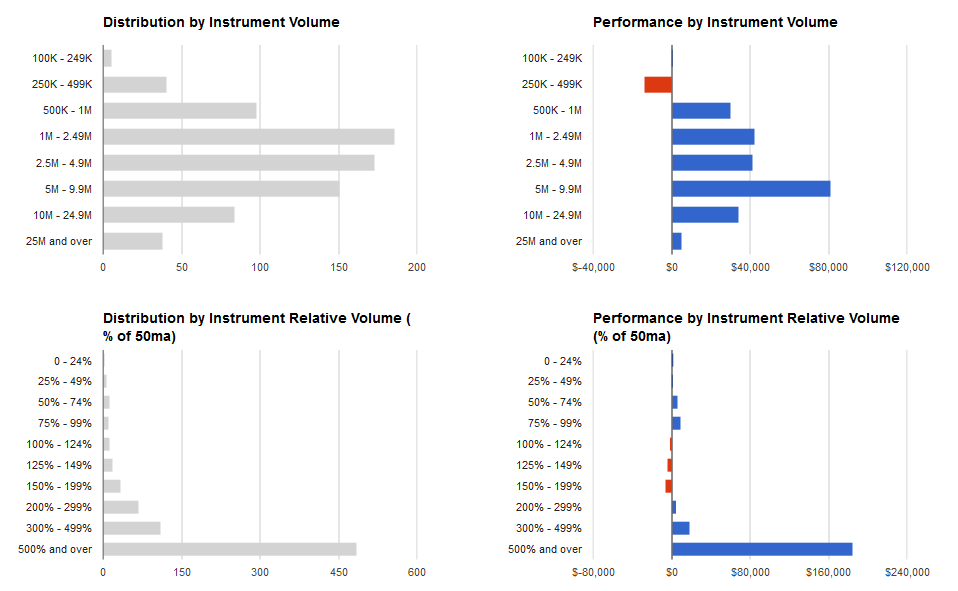
2016 Trades by Highest Relative Volume – Trading Breaking News
As part of my strategy I focus on trading stocks with high relative volume. High relative volume is the result of breaking news and technical catalysts. As you can see below, the fact majority of the stocks I trade have high relative volume, and most have over 1mil shares of volume. I do better on stocks with higher volume, and lost money on stocks trading on lighter volume of less than 500k shares.
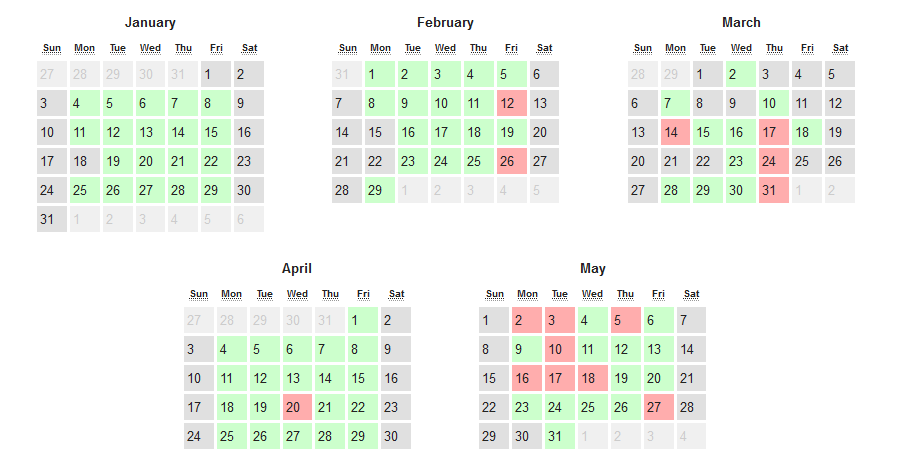
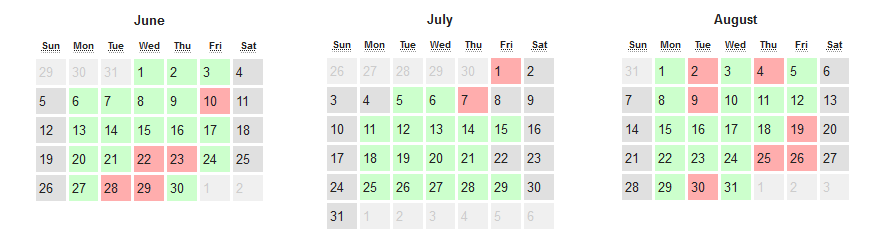
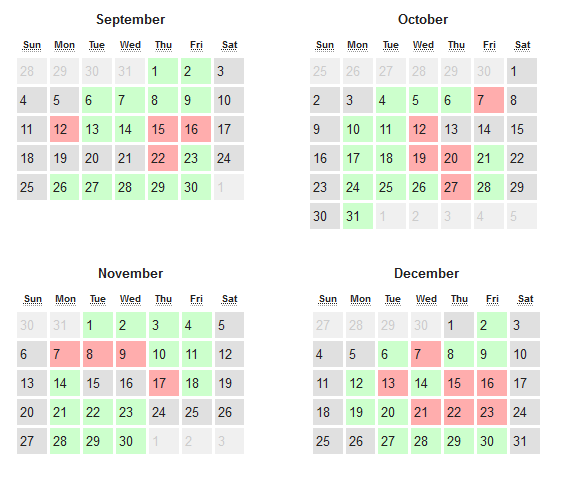
2016 Trades by Time of Day & Day of Week & Month of Year
My performance based on the time of day is predominately 9:30-10am. I love trading the open because that’s when the stocks that reported news overnight make the big move. As we move further away from the open my profits decrease and my number of trades decrease. I seem to perform best on Monday and Wednesday, and the worst on Tuesday and Thursday. I’m not sure why! We’ll see if that trend continues in 2017. As you can see from the monthly breakdown below, the year started off slowly with February and May being my worst months, but I quickly surged forward in June and kept that momentum going through the end of the year.

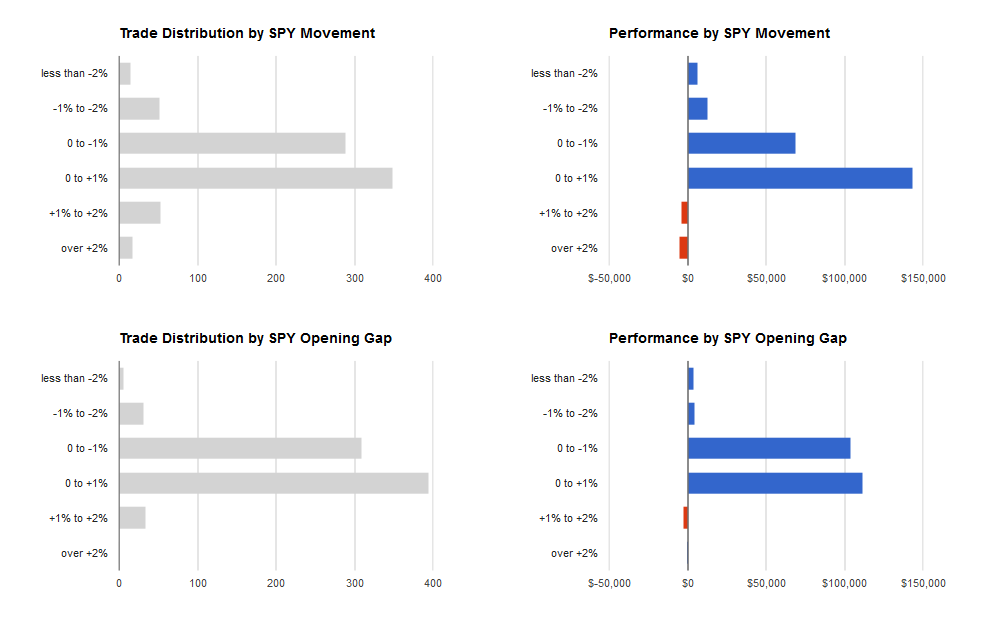
2016 Trading based on SPY
I’ve always felt my performance isn’t very closely tied to the overall market because I’m trading stocks with breaking news. When stocks have news, they have a reason to move regardless of the overall market. As you can see below, I made the majority of my profits on days when the market was up slightly, but since the market was up overall in 2016, that was most days. If anything, I seem to not perform as well when the market is up more than 1%, but I’m not sure if that’s directly related to the market.
2016 Broker Statement
Year-to-Date profits show $516.06 less than my trading reports. This amount was for transaction fees charged by my broker on a monthly basis.
